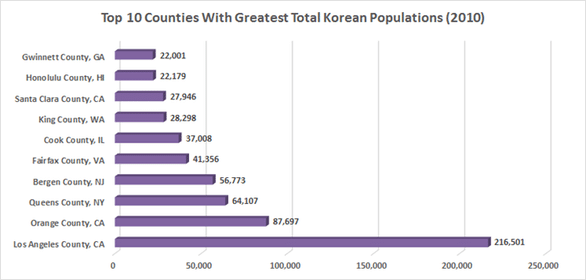
TOP 10 COUNTIES RANKED BY TOTAL KOREAN POPULATION
Los Angeles County has the highest Korean population in the country by a wide margin: its population is greater than that of the next three counties combined. Orange County in California and Queens County in New York contain the second and third largest Korean populations, respectively. Koreans make up about 16% of the total API population in LA County. The combined populations of LA County and Orange County make up over a fifth of the country’s entire Korean population.
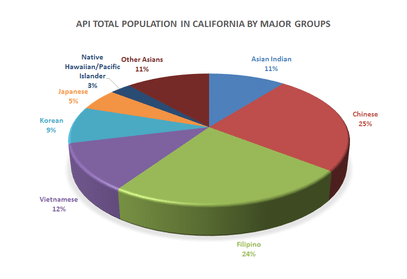
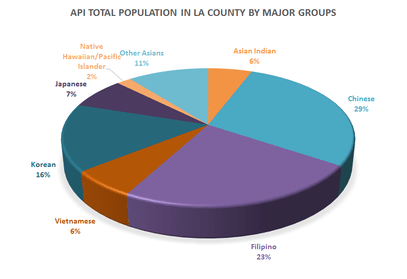
ASIAN/PACIFIC ISLANDER TOTAL POPULATION
Korean Americans make up about 9% of the total Asian/Pacific Islander population in California but they comprise a little over 1% of the total population of California. Korean Americans make up about 6% of the total Asian/Pacific Islander population in LA County but only 2% of the total population of LA County. Koreans are the fifth largest Asian/Pacific Islander group in the country, the sixth largest in California, and the third largest in LA County.
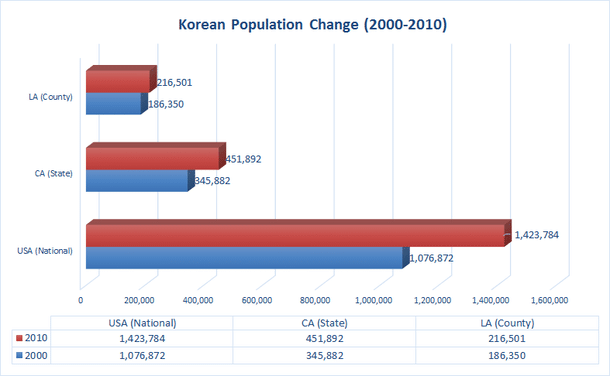
KOREAN POPULATION CHANGE
The U.S. experienced a 32% increase in the total Korean population between 2000 and 2010. California experienced a 31% increase in the total Korean population between 2000 and 2010. LA County experienced a 16% increase in the total Korean population between 2000 and 2010. In 2010, LA County alone was home to about 15% of the total Korean population in the country. The county also had almost half of the total Korean population in California.
OVERVIEW OF TOP 5 KOREAN AND API STATE POPULATIONS
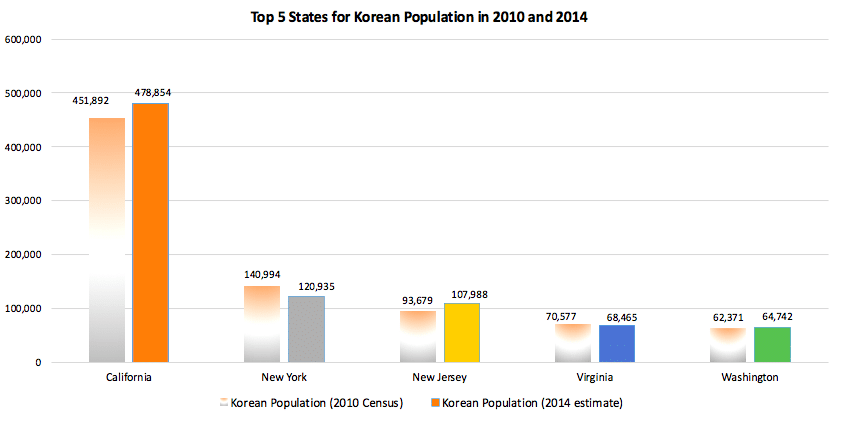
In 2010, the top 5 states with the highest number of Koreans consisted of a little more than ⅓ of our total Korean population. Similar to the Korean data, the top 5 states for the highest number of Asian and Pacific Islanders in 2010 consisted of a little more than ⅓ of the total API population in the U.S.
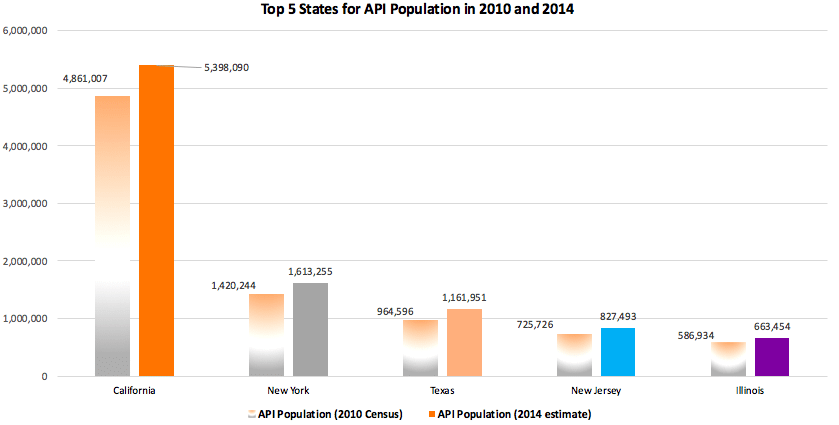
The 2010 Census for the Asian Pacific Islanders recorded that the top 5 states California, New York, Texas, New Jersey, and Illinois accounted for a little more than third of the general API population. Within that third, the state of California had accounted for half of the general API population. This equates to the state of California having a fifth of the general API population in the country.
KOREAN POPULATION
Similar to the general API population, the 2010 Census recorded that the top 5 states of California, New York, New Jersey, Virginia and Washington held a little more than a third of the whole Korean population in the United States. From that third, the state of California alone held half of the Korean population, making the state of California accountable for a fifth of the Korean population in the United States.
OVERVIEW OF KOREAN AND API CITIZENSHIP
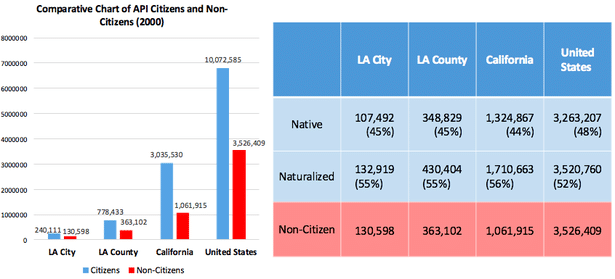
According to the 2000 Census data on citizenship, a little more than 3/5 of the Korean population in the United States were citizens. The data from the same source for the Asian and Pacific Islanders reported that 2/3 of the general API population in the United States were citizens.
*Tables and Graphs
Source: U.S. Census Bureau 2000 Decennial Census Data
CITIZENSHIP
Comparing the 2000 Census data for citizenship among the Korean population and the general API population, we can conclude that the Korean population had lower statistics in regards to citizenship status. The percentage of Koreans does not reach the same percentage as the API population in regards to being citizens, and with the exception of the city of LA, the percentage of Korean Non-Citizens was higher in comparison to the percentage of API Non-Citizens. The Korean Non-Citizen percentage was seven percent lower, reporting only 28% Non-Citizens while 35% of the API community was reported as Non-Citizens. Despite this, the statistics for Korean Non-Citizens were higher, with an 11% difference in the county of LA, 10% difference in the state of California, and 7% difference in the nation overall.
CONCLUSION
Last Updated August 2020.
Census Demographics and and Citizenship: Conclusions Pt.I
Korean Americans comprise roughly 1.2% of the total population of California as of 2018, which is a small increase of 0.2% from 2010. California-based Korean Americans comprise 32% of the country’s Korean population and LA County-based Koreans alone make up roughly 15% of the total Korean population in the US. LA County made up 46% of the Korean population in California itself. Considering that nearly half the Korean population of California is based in LA County, which harbors the largest concentration of Korean-Americans in the country, it is imperative that the Korean-American political voice in this area is strengthened. One aspect of creating a more substantial political presence is allowing a more economical and accessible naturalization process for voting-age Korean-Americans in Los Angeles (18+). Though the rates of Korean citizenship in Los Angeles do not differ significantly than those of the total API population of Los Angeles (76% vs 78%), there are large discrepancies between the rate of citizenship for Koreans who are under 18 compared to those who are 18+. We see a much larger percentage of 18+ Koreans who are non-citizens in LA County compared to those who are under 18, being 32% and 16% respectively.
Recommendations:
Since 1983, KAC has assisted more than 40,000 people with their naturalization process and stands as one of the longest continuously running Korean American organizations to provide such services. Given half of the Korean population of California is based in LA County, it is imperative for KAC to continue providing our citizenship services to assist our constituents who are largely monolingual, elderly, and lower income and work closely with the United States Citizenship and Immigration Services (USCIS) for updates on the naturalization process and application fees.
Census Demographics and and Citizenship: Conclusions Pt.II (COVID-19)
Though the actual recorded cases of Asian coronavirus contraction in LA County and CA is lower than their population estimates (2.7% vs 14.5%/ 5% vs 15%), those 2.7% of total LA County cases account for 14.5% of total coronavirus deaths in LA County and those 5% of total CA cases account for 15% of total coronavirus deaths in CA as of August 5th, 2020. It may be argued that testing availability is low in the Asian community of LA County and CA since Asians only account for 2.6% of those tested in LA County and that may be what is lowering the contraction estimates considering that a disproportionate percentage of Asians are dying from coronavirus (Asians account for 2.7% of total contractions vs 14.8% of deaths in LA County / 5% contractions vs 13% of deaths in CA).
Recommendations:
KAC recommends more widespread access to COVID-19 testing to Asian communities in CA and LA County, particularly areas with larger Asian-American populations and those in lower-income regions. As well, translation resources for COVID-19 testing to Asian communities in CA and LA County are needed, as well as more data collection and research on specific Asian communities affected by COVID-19 in CA and LA County (i.e. no korean specific data that has been collected).
Sources:
- 2018 American Community Survey 1-Year Estimates, Demographics Data: Asian and API Population Data
- 2018 American Community Survey 1-Year Estimates, Demographics Data: Korean Population Data
- Source: 2015 American Community Survey 5-Year Estimates, Citizenship Data: Korean Population Data
COVID Data (as of 8/5/2020):
- CA Department of Public Health: COVID-19 Race and Ethnicity Data
- LA County Public Health: LA County COVID-19 Surveillance Dashboard
- Asian American Research Center on Health: Asian COVID-19 Mortality
*First Publication Date: August 2017.
Written and Compiled by: Janet Kang, Susan Joh, and Sophia Shin
*Updated August 2020.
Written and Compiled by: Elisa Sue Young Park
Reviewed by: Esther Jung, Sophia Shin
