This section will cover industry, employment, and income data gathered from the American Census Bureau from the years 2010 to 2014. The two population groups covered are ethnic Koreans and Asians in the city of Los Angeles, the county of Los Angeles, California, and the United States overall. The industry category encompasses data regarding the trends of population groups in the different industry sectors including but not limited to finance, manufacturing, and retail. The employment category encompasses data regarding the trends of female and male populations in the labor force along with labor force proportions. The income category covers the trends from annual household incomes to social security and cash public assistance income growth.
INDUSTRY
Industry Growth of Koreans in Different Industries in the U.S.
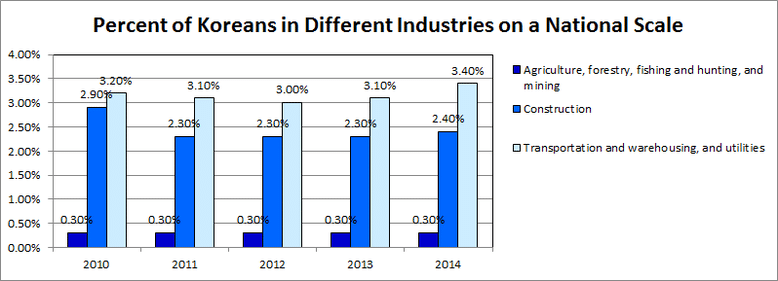
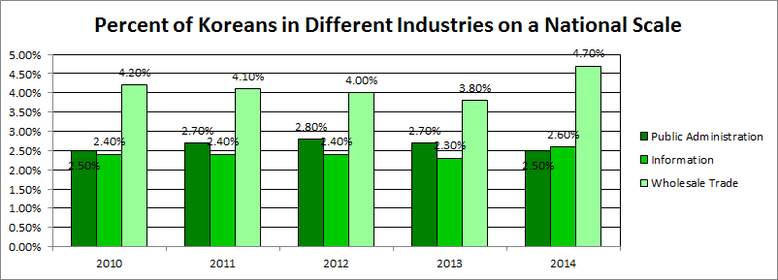
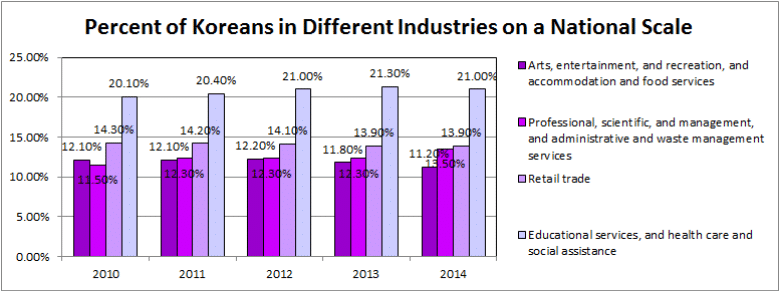
A few industries remained fairly stable between the five year span between 2010 and 2014. For instance, the agricultural industry sector consistently maintained 0.3% of the Korean workforce between 2010-2014 while 20% of Koreans work in Education; 11-12% of the Korean population work in Food Services and 14% in Retail.
A few other industries experienced a decline. There was a drop in the Korean percentage in construction from 2.9% to 2.4% and a gradual decrease in the Wholesales Industry from 4.2% to 3.9% between 2010 and 2013 until 2014 when the percentage jumped from 3.8% to 4.7%.
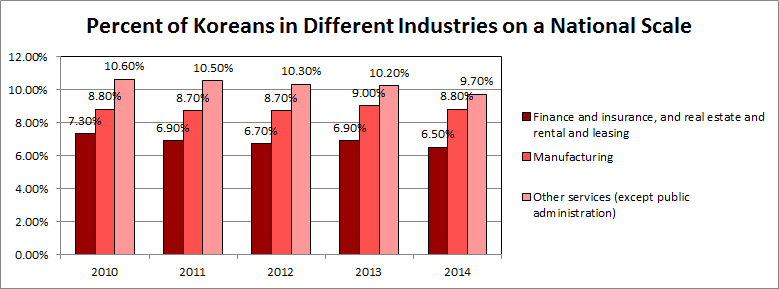
In addition, certain industries followed trends that contradict the patterns from graphs on smaller scales. One example is that there is a steady decline in Other Services with a drop from 10.6% to 9.7% between 2014 and 2010 whereas in comparison, the percentage of Koreans who work in Other Services in Los Angeles City increased from 6.0% to 7.4%. Furthermore, manufacturing consistently stayed at 8.8% on a National level, but increased in Los Angeles city, Los Angeles County, and California.
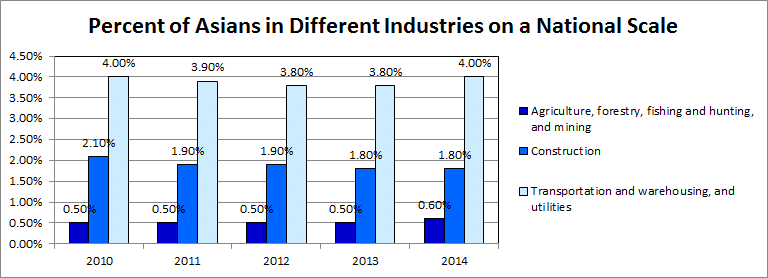
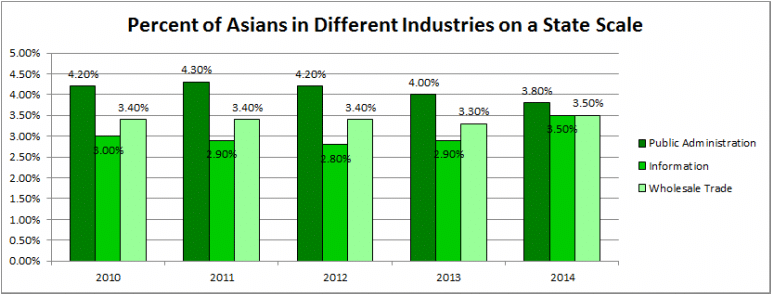
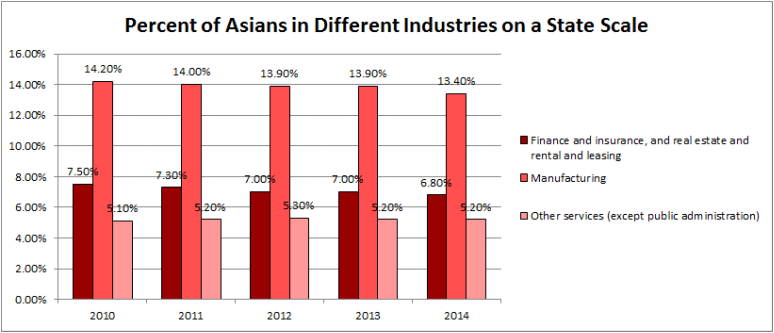
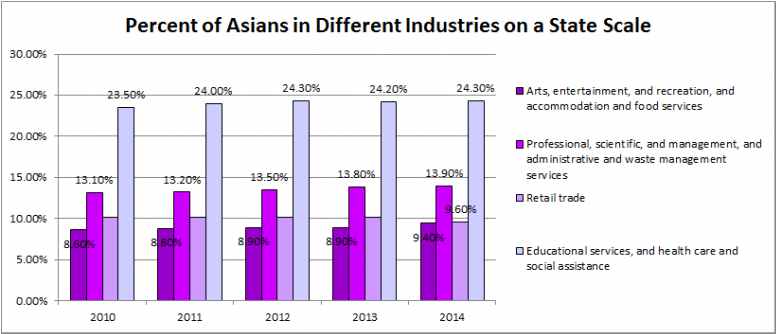
There was a higher percentage of Asians as a whole than Koreans in certain industries. For example, 0.5% to 0.6% of Asians were employed in the Agriculture industry, whereas only 0.3% of Koreans work in Agriculture. In addition, an average of 4% of Asians work under the Transportation industry, but Koreans fluctuate between 3.1 and 3.4%. Two more drastic examples include the fact that 24% of Asians are in the Education, Healthcare, and Social Service, but only 20% to 21% of Koreans. Additionally, the Manufacturing Industry consists of 12% of Asians, but 9% of Koreans.
There is a higher percentage of Koreans than Asians in the Wholesale Industry and Construction. In the Wholesale Industry, the percentage of Koreans range between 3.8% and 4.7% in comparison to the 2.7% to 2.9% of Asians. Similarly, between 2.3% to 2.9% of Koreans are employed in Construction, but only 1.8% to 2.1% of Asians work in Construction.

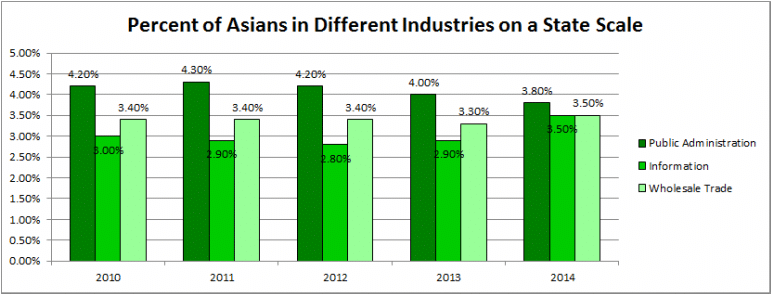
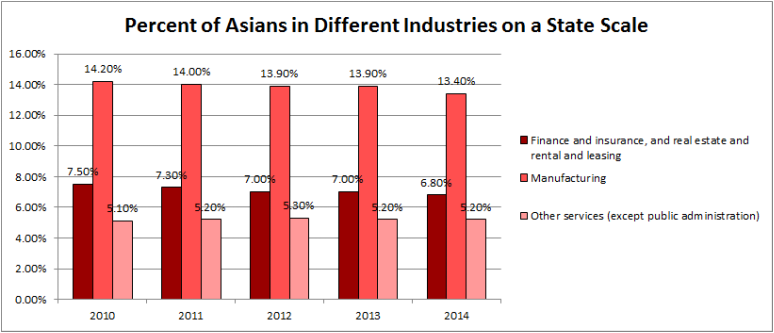
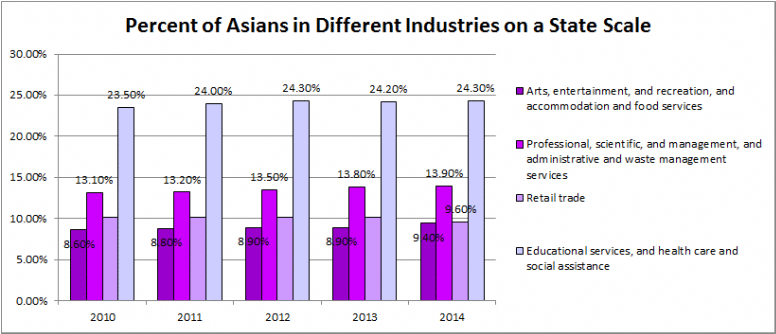
Similar to the National level, there is a higher percentage of Koreans than Asians in the Construction and the Wholesale Trade industries. Between 2010 and 2014, roughly 3% of Koreans worked in construction compared to 2% of Asians in the same sector. Similarly, 5% to 7% of Koreans work in Wholesale Trade range, as opposed to the 3.5% of Asians who work in the sector.
Other industries where there were disparities between the percentage of Koreans to Asians is in Other Services and Retail. Between 7.2% and 7.9% of Koreans work in Other Services, but only 5.1% to 5.3% of Asians are in the Other Services category. Furthermore, between 2010 and 2013 around 13% of Koreans worked in Retail compared to the 10% of Asians in the sector.
Both Koreans and Asians also followed certain trends. Between 2012 and 2014, the percentage for Public Administration fell for both Koreans and Asians. For Koreans, the number falls from 2.3% to 2.1% while Asians fell from 4.2% to 3.8%. Likewise, between 2010 and 2014 there is a gradual decrease in Finance for both Koreans and Asians. Koreans fell from 8.3% to 7.3% while Asians fell from 7.5% to 6.8%.


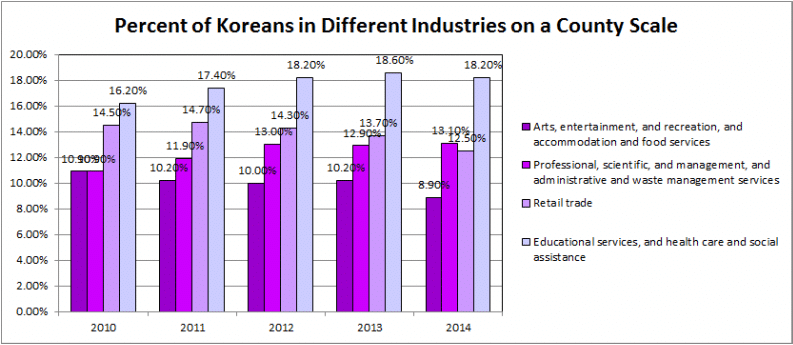
On a county level, the number of Koreans in a handful of industries fluctuates. Between 2010 and 2013, the percentage of Koreans in Arts, Entertainment, and Food Services remains consistent around 10.5% but falls to 8.9% in 2014. In addition, there is a steady decline between 2010 and 2013 in construction from 3.4% to 2.5% but jumps back up to 3.3% in 2014. Manufacturing drops from 10.9% to 10.4% in 2012 but increases in 2013 and 2014 up to 11.5%. Between 2010 to 2013 there is an increase in Educational, Healthcare, and Social Services up from 16.2% to 18.6% but falls back to 18.2% in 2014.
A few other notable trends include that Wholesale Trade is consistently within a range from 6.9% to 7%, an increase in Professional, Scientific, and Management fields from 2010 to 2012 at 10.9% to 13% and a decrease in Transportation from 4.5% to 3.3%.
PERCENT OF ASIANS IN DIFFERENT INDUSTRIES IN LOS ANGELES COUNTY
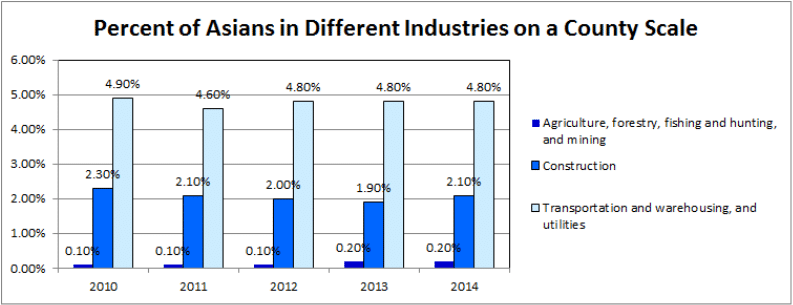

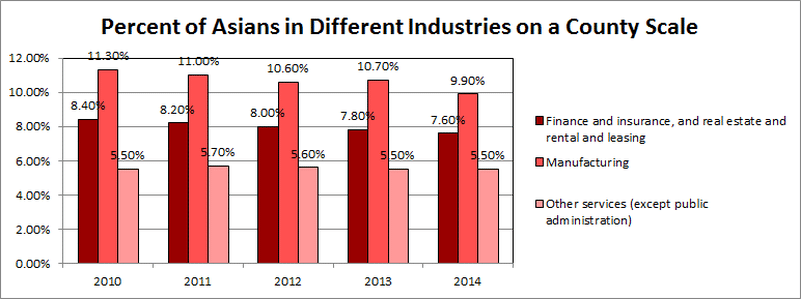
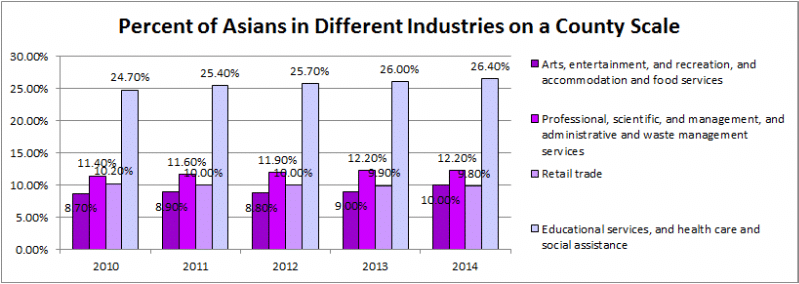
A few distinguishable disparities between Asians and Koreans can be seen across Educational, Healthcare, and Social Services, Retail, and Public Administration. The percentage of Asians increases from 24.7% to 26.4% in Educational, Healthcare, and Social Services compared to Koreans who range from 16.2% to 18.2%. Additionally, 10% of Asians work in retail while up to 14% of Koreans fill the same industry sector. Lastly, around 3.5% of Asians are in Public Administration while only 1.5% of Koreans.
More contrasting trends can be seen in Manufacturing, Other Services, and Transportation. There is a decrease in Asians in Manufacturing from 11.3% to 9.9% while there is an increase of Koreans from 10.9% to 11.5%. Furthermore, the number of Asians in other services is consistently around 5.5% while Koreans fluctuate between 6.5% and 7.7%. As for Transportation, Asians are consistently around 4.8% whereas the percentage of Koreans decreases from 4.5% to 3.3%.
PERCENT OF KOREANS IN DIFFERENT INDUSTRIES IN LOS ANGELES CITY
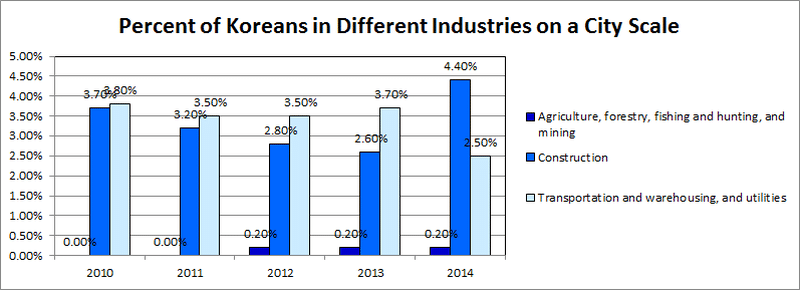
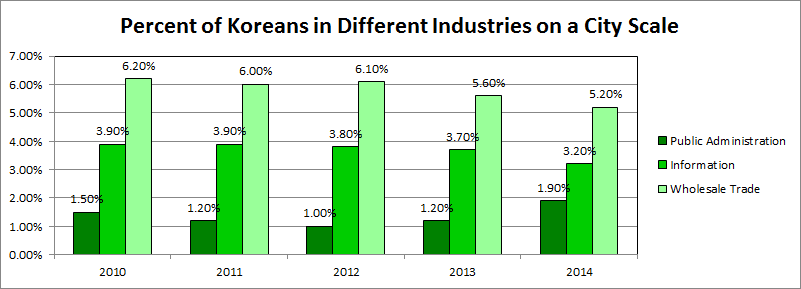
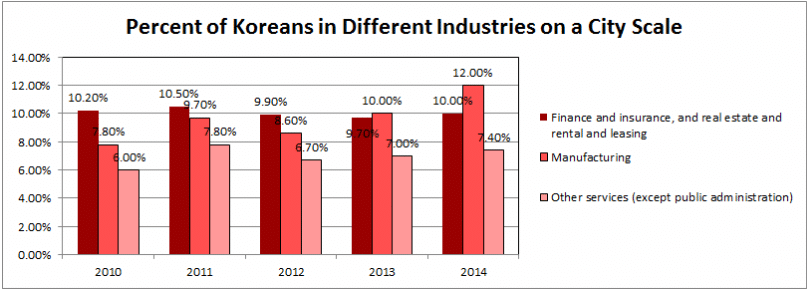
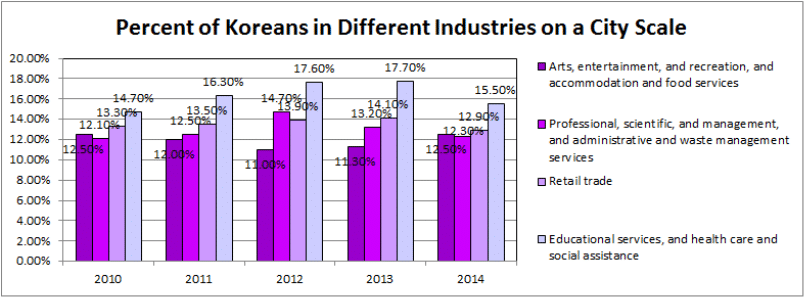
Some contrasting patterns between Koreans and Asians are that the number of Koreans in Wholesale Trade falls from 6.2% to 5.2% between 2010 and 2014 but the number of Asians rises from 3.6% to 3.8% during 2010 to 2011 and falls back down from 3.8% to 3.4% between 2011 to 2014. Moreover during 2010 to 2014 the percentage of Asians working in Manufacturing falls from 9.8% to 8.4% while the percentage of Koreans rises from 7.8% to 12%.
Another drastic discrepancy is that between 2010 and 2014, 14.7 to 17.7% of Koreans work in Education, Healthcare, and Social Services while between 26.2% to 28.8% of Asians work in this field.
EMPLOYMENT
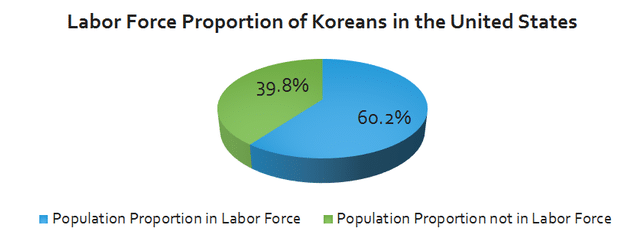
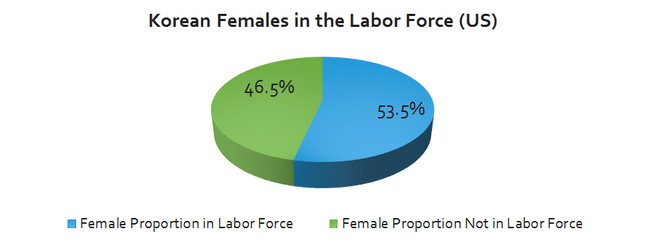
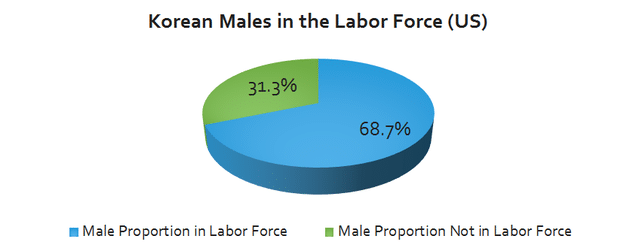
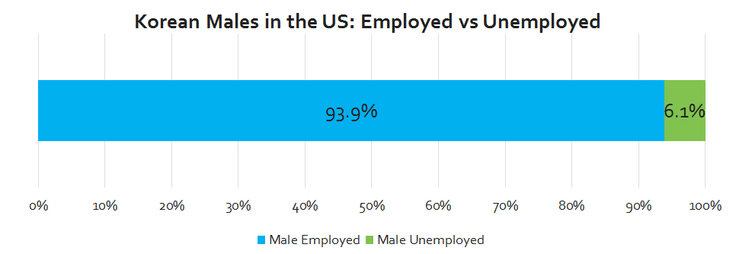
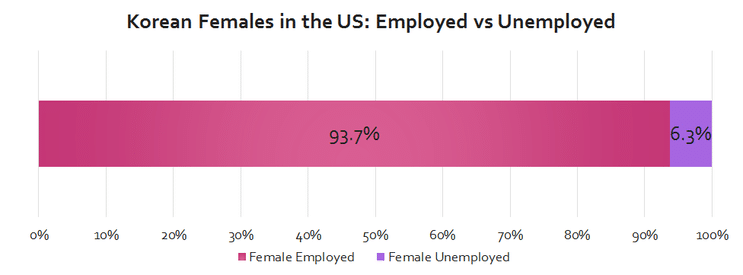

The 2014 ACS 1-year Estimates claimed that there were about 1,262,903 Koreans, ages 16 years and older, in the United States. Approximately 56.0% of this population identified themselves as female and the remaining 44% identified themselves as male. Of this number, the survey estimated that 60.2% of the total population of Koreans was considered to be in the Labor Force, while 39.8% of the population was not considered to be in the Labor Force. Based solely on the data about Korean females, 53.5% of them were considered to be in the Labor Force and the remaining 46.5% of them were not considered to be in the Labor Force. On the other hand, 68.7% of the Korean males were considered to be in the Labor Force with the remaining 31.3% not in the Labor Force. Approximately 93.9% of the overall Korean male labor force was considered employed, and the other 6.1% was considered unemployed. Korean females had similar percentages as approximately 93.7% of the overall female labor force was considered employed and the other 6.3% was considered unemployed.
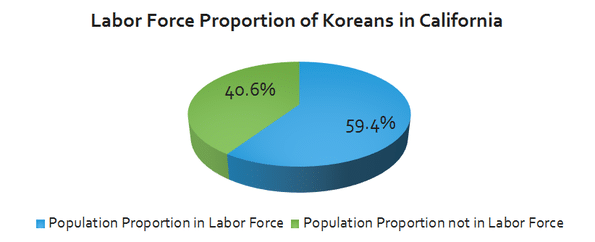
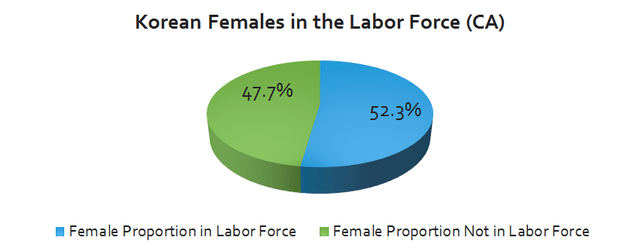
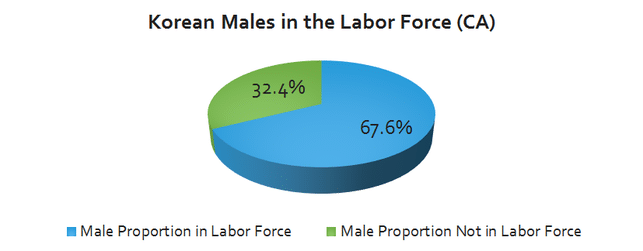
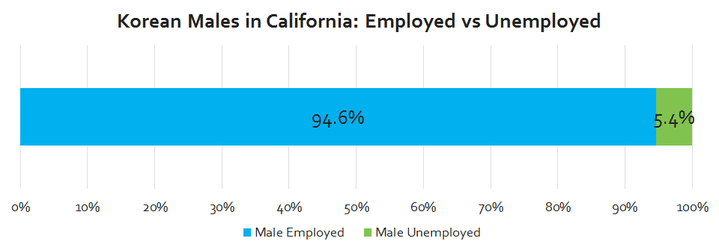
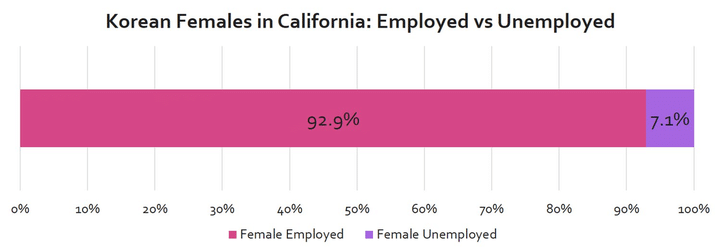
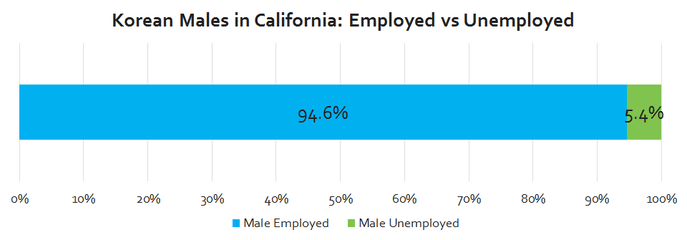
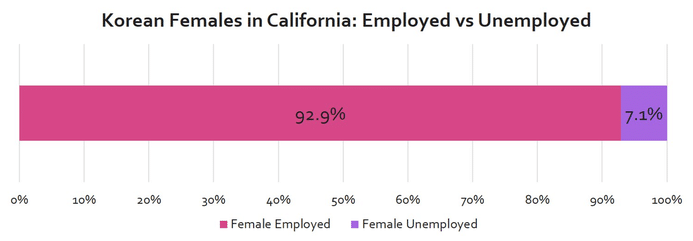
The 2014 ACS 1-year Estimates claimed that there were about 411,910 Koreans, ages 16 years and older, in California. Approximately 53.6% of this population identified themselves as female and the remaining 46.4% identified themselves as male. Of this number, the survey estimated that 59.4% of the total population of Koreans was considered to be in the Labor Force, while 40.6% of the population was not considered to be in the Labor Force. Based solely on the data about Korean females, 52.3% of them were considered to be in the Labor Force and the remaining 47.7% of them were not considered to be in the Labor Force. On the other hand, 67.6% of the Korean males were considered to be in the Labor Force with the remaining 32.4% not in the Labor Force. Approximately 94.6% of the overall Korean male labor force was considered employed, and the other 5.4 % was considered unemployed. Approximately 92.9% of the overall female labor force was considered employed and the other 7.1% was considered unemployed.
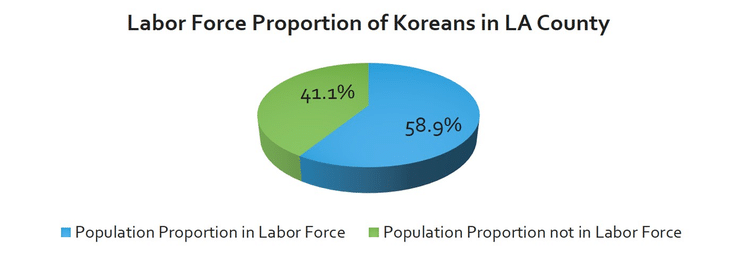



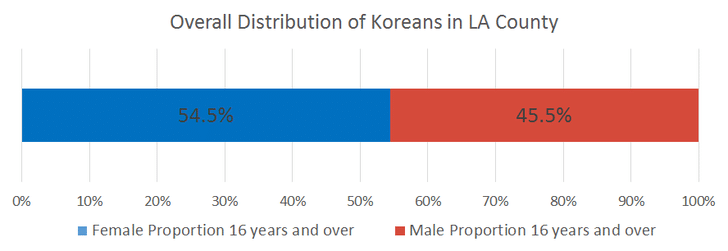
The 2014 ACS 1-year Estimates claimed that there were about 192,593 Koreans, ages 16 years and older, in Los Angeles County. Approximately 54.5% of this population identified themselves as female and the remaining 45.5% identified themselves as male. Of this number, the survey estimated that 58.9% of the total population of Koreans was considered to be in the Labor Force, while 41.1% of the population was not considered to be in the Labor Force. Based solely on the data about Korean females, 52.1% of them were considered to be in the Labor Force and the remaining 47.9% of them were not considered to be in the Labor Force. On the other hand, 67.0% of the Korean males were considered to be in the Labor Force with the remaining 33.0% not in the Labor Force. Approximately 94.6% of the overall Korean male labor force was considered employed, and the other 5.4 % was considered unemployed. Approximately 92.1% of the overall female labor force was considered employed and the other 7.9% was considered unemployed.

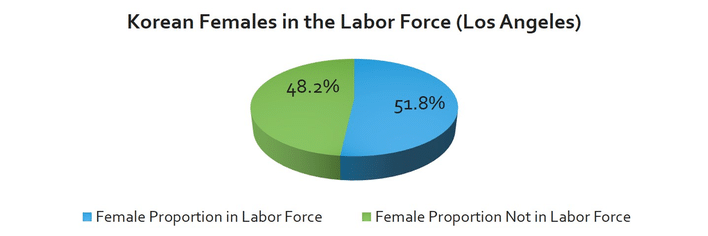
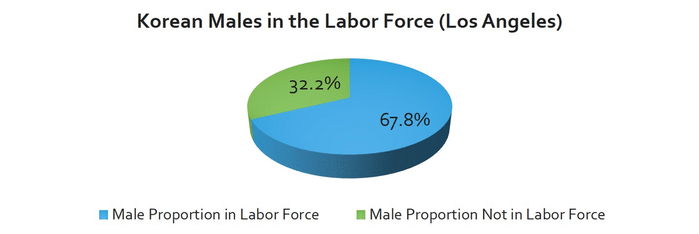
The 2014 ACS 1-year Estimates claimed that there were about 102,959 Koreans, ages 16 years and older, in Los Angeles County. Approximately 55.8% of this population identified themselves as female and the remaining 44.2% identified themselves as male. Of this number, the survey estimated that 58.9% of the total population of Koreans was considered to be in the Labor Force, while 41.1% of the population was not considered to be in the Labor Force. Based solely on the data about Korean females, 51.8% of them were considered to be in the Labor Force and the remaining 48.2% of them were not considered to be in the Labor Force. On the other hand, 67.8% of the Korean males were considered to be in the Labor Force with the remaining 32.2% not in the Labor Force. Approximately 93.4% of the overall Korean male labor force was considered employed, and the other 6.6 % was considered unemployed.Approximately 90.7% of the overall female labor force was considered employed and the other 9.3% was considered unemployed.
INCOME
INCOME/ASIAN HOUSEHOLDS/FAMILIES/INDIVIDUALS DEMOGRAPHIC GROWTH
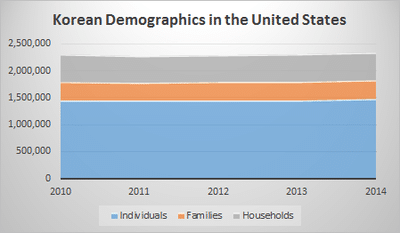
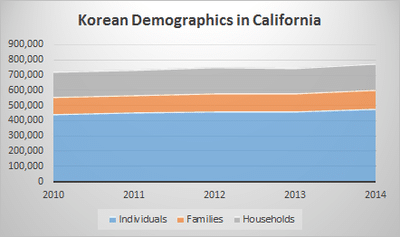
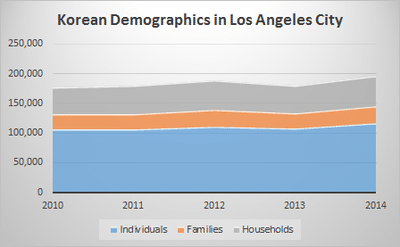
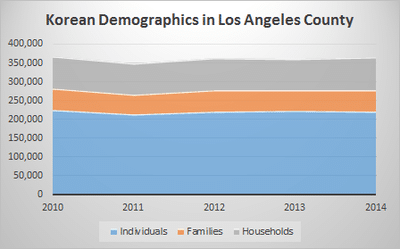
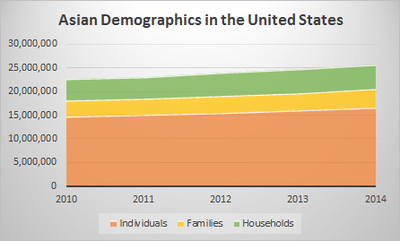
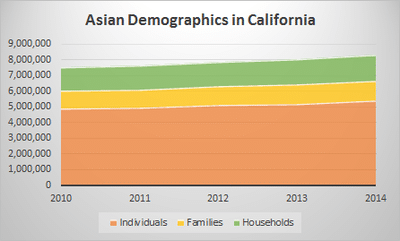
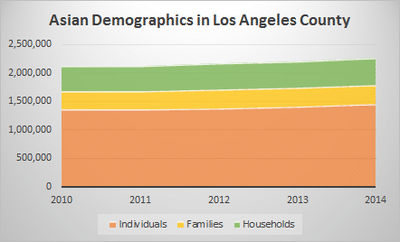

The Korean demographic data tended to fluctuate more than its Asian demographic counterpart. While the Asian demographics show a gradual overall increase from 2010-2014 on all levels from Asians in the U.S. to Los Angeles city, Korean demographics shows more scattered and varied data. Asian demographics increased nationally by 1-2 million people; Koreans on a national scale only increased by 1,000 people in the four year incremental period.
In California, Asian demographic data continued to surpass Korean growth for all variables (households, families, individuals). Asian individuals increased by ~500,000 during the four years while Koreans increased by a mere ~30,000. Californian households and families for Koreans shared a similar trend growth of 11-13,000 from 2010-2014. In contrast, Asian households and families in California grew exponentially by 130-170,000 by the end of 2014.
In Los Angeles County, Asian and Korean demographic data differed significantly. While Asian populations generally grew from 25-93,000 people on all variables, Korean individual population actually decreased by 4,000 and only grew families and households by 800-2,000 people.
Asian and Korean data shared the closest trend similarities in Los Angeles city, where populations increased from 4,000-20,000 on all variables.
PERCENTAGE OF KOREAN AND ASIAN HOUSEHOLDERS
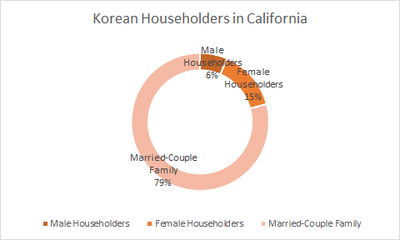
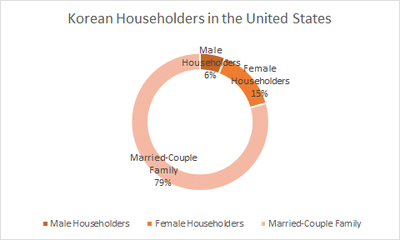
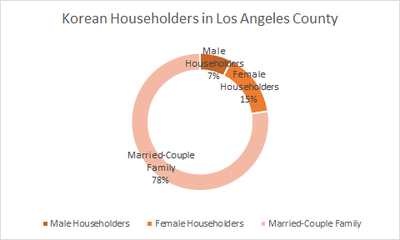
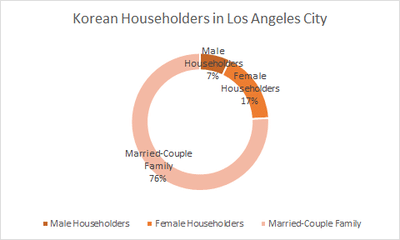
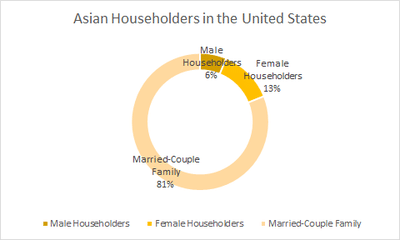
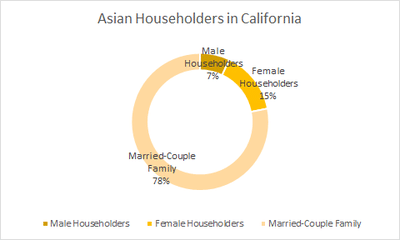
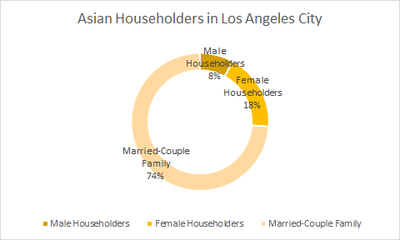
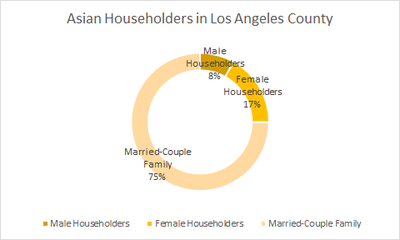
Generally, all four levels (United States, California, Los Angeles County, Los Angeles City) display very similar patterns for both Asian and Korean householders from 2010-2014. Asian and Korean married-couple families filled the majority of the population (74-81%), female householders came next (13-18%), and male householders last (6-8%). Nationally, Asian married-couple families held the highest percentage (81%), while Los Angeles city had a higher percentage of Korean married-couple families (76%) than Asians in the city by 2 percent. Los Angeles County and city holds the most Asian male householders, with no spouse present (8%), with Korean male householders one percent behind (7%) in the city. Both Asian and Korean female householders with no husband present permeate Los Angeles city at 18% and 17%, respectively. This percentage is significantly higher than the 13% and 15% of Asian and Korean female householders on a national scale.
GROWTH OF MEAN EARNINGS FOR WORKERS
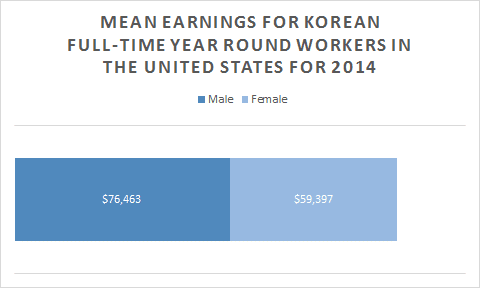

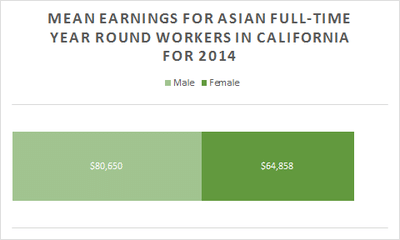
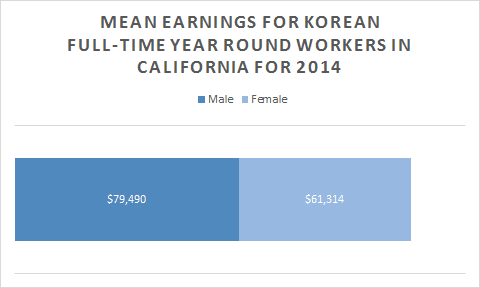
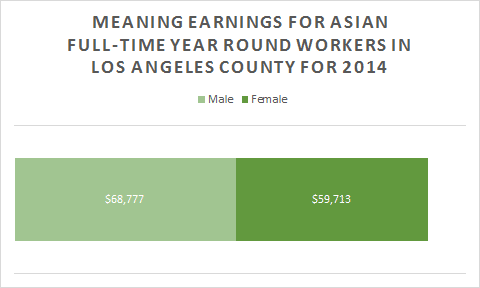
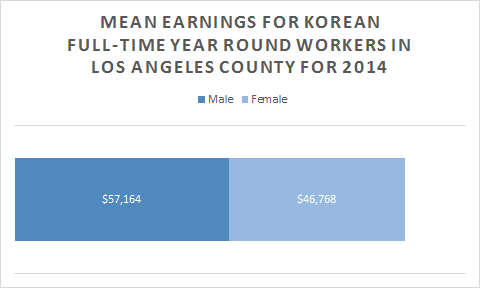
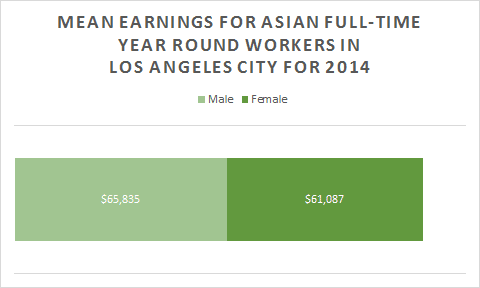
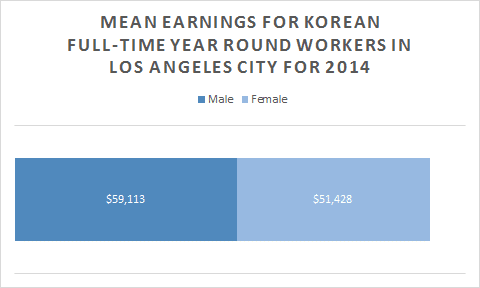
Across the board, Asian full-time year round workers (both male and female) received higher mean earnings than their Korean counterparts on all levels (nationally, California, Los Angeles County, Los Angeles city), though the difference is not substantial.
Female full-time year round workers received significantly doctored mean earnings when compared to male workers, receiving $6,000-$16,000 in salary less than males.
Asian male full-time year round workers received a mean earnings of $80,000 in California, while Korean male workers in the same state received $79,000. Asian male workers received the smallest pay in Los Angeles city at $65,000, while Korean male workers received the smallest pay at $57,000 in Los Angeles County.
Asian female workers earn $64,000 in California, while Korean female workers receive $61,000 in the same state. Both Asian and Korean female workers receive the smallest pay in Los Angeles County at $59,000 and $46,000, respectively.
MEDIAN ANNUAL HOUSEHOLD GROWTH FROM 2010-2014
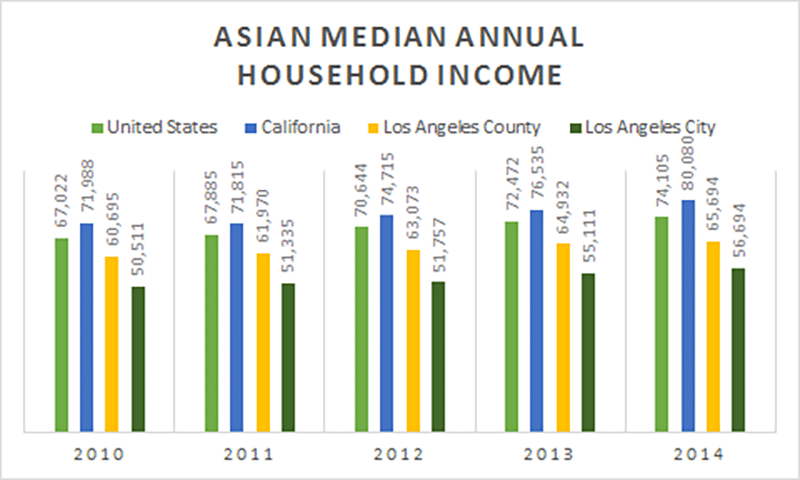
Household income includes the income of every resident over the 15 years of age (including wages and salaries, unemployment income, disability payments, received child support payments, etc.) who do not need to be related to the head of the household, according to the 2009 U.S. Census.
The median annual income for Korean and Asian households displayed a general increase from 2010-2014. Asians tended to have a higher household income than their Korean counterparts on all levels. Overall, Asian household income was higher than Korean income wages by $15-19,000 in 2014.
On a national scale, annual income for Korean households increased by $8,370 from 2010-2014. By 2014, the median annual income for Korean householders was $58,573. Nationally, the income for Asians in the U.S. increased at a slightly slower rate ($7,083) over the four years, however, Asian householders still made around $15,0000 more than Koreans at $74,105 by 2014.
Californian Korean household income increased by $7,207 after the four year period, while Asian household income surpassed them with an increased salary amount of $8,092 by 2014.
Asian household income experienced the least amount of growth in Los Angeles County by the end of four years. By 2014, Korean households increased by $2,665 while Asians increased by $4,999. Korean household income experienced the least amount of growth in Los Angeles city, only increasing by $2,602 at the end of 2014, while Asian household income increased by $6,183.
SOCIAL SECURITY INCOME GROWTH FROM 2010-2014
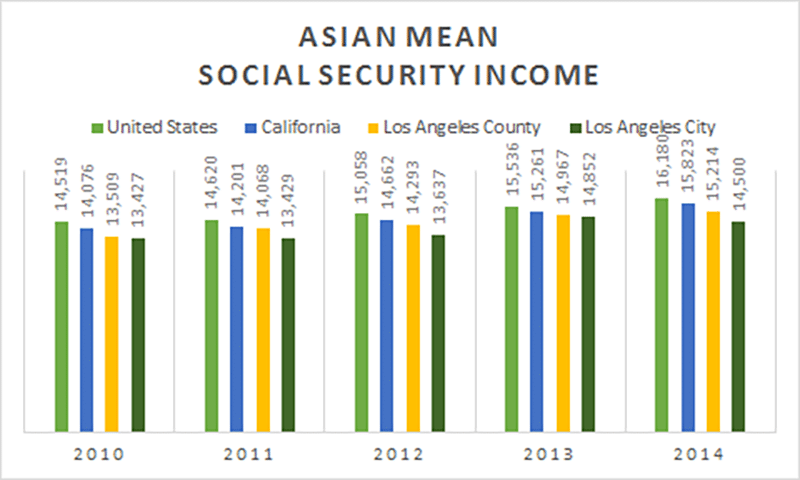
Recipients of Social Security receive benefits based on earnings financed by employer and wage contributions with no income or resource limit. Recipients also receive retirement (62+), survivor, and disability (including blindness) benefits as well.
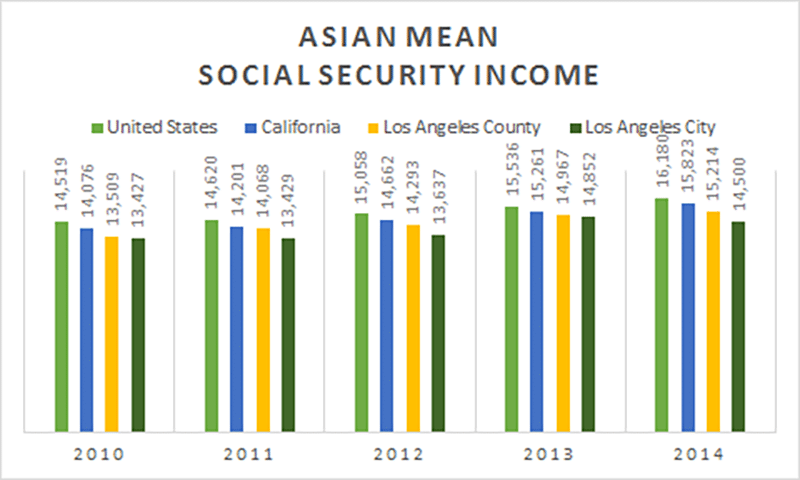
Both Asian and Korean households experienced Social Security income growth from 2010-2014. Asian households experienced higher S.S. income than Koreans by $1-3,000 by 2014.
Social Security income growth in Korean households nationally increased by $1,275 during the four years with an income of $14,955 by the end of 2014. Asian household Social Security income on a national scale increased by $1,661 for the same duration with an income of $16,180 by 2014. Social Security income for Koreans in California increased by $1,032 to be $13,905 by the end of 2014. Asians in California also experienced an increase in social security income by $1,747 from 2010-2014 with a S.S. income of $16,180 by 2014. Korean Social Security income experienced the least amount of growth in Los Angeles County during the four years only growing by $611 with a 2014 income at $11,785.
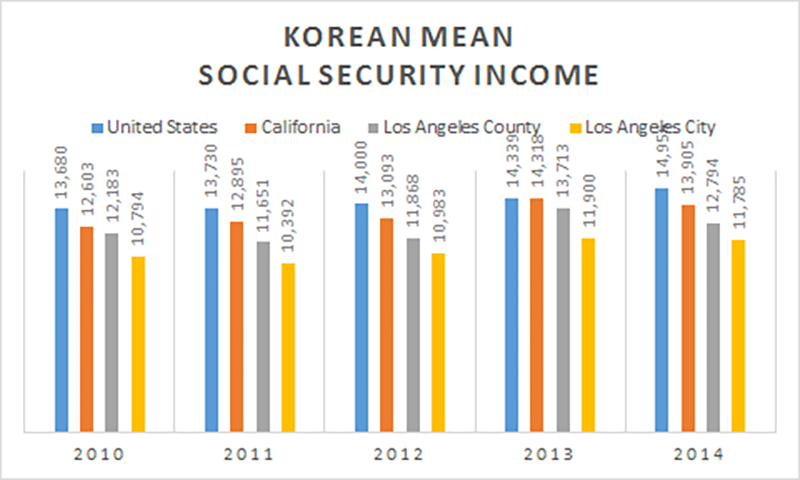
Asian S.S. income increased by $1,705 from 2010, and by 2014 Asian householders received $15,214 in S.S. income. In Los Angeles city, Korean households received $11,785 by 2014 in Social Security income, a general increase by $991 since 2010. Asian households on the other hand received the lowest income compared to the national, state, and county levels at $14,500, a $1,253 increase from 2010.
MEAN RETIREMENT INCOME GROWTH FROM 2010-2014
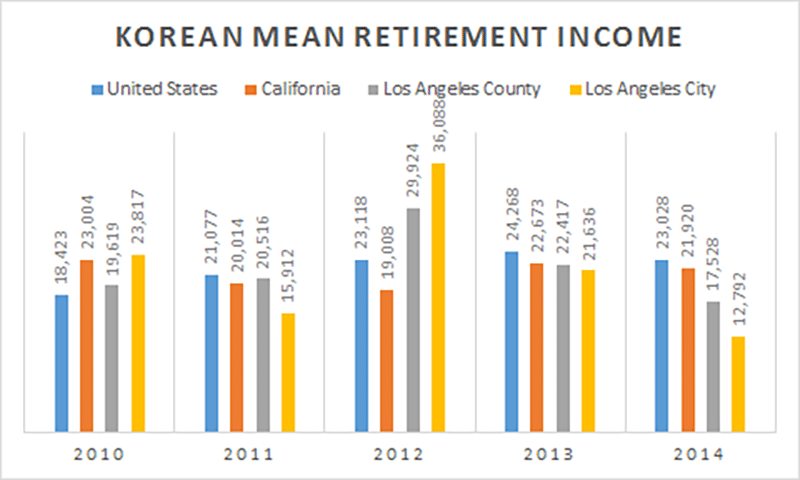
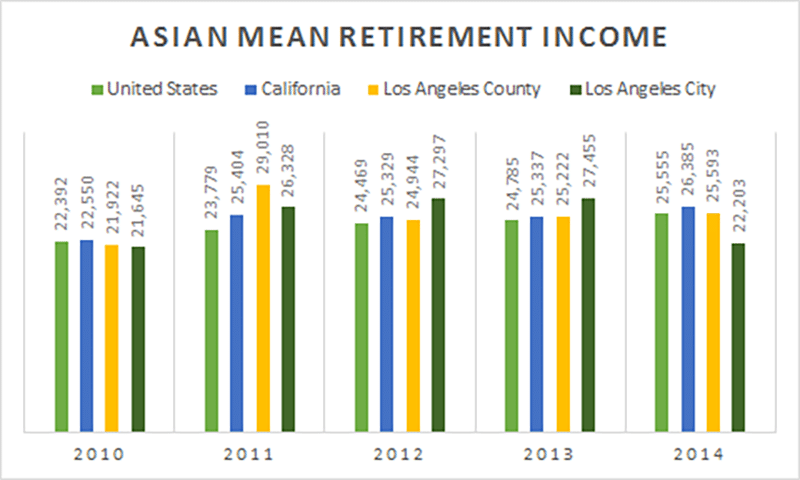
Retirement income for both Koreans and Asians generally experienced a decline from the years 2010-2014, with scattered years of increases in between. Overall, Asians experienced higher retirement incomes than their Korean counterpart by $2-9,000 on all levels.
Retirement income for Koreans on a national scale increased by $4,605 from 2010 with a final income of $23,028 in 2014 – though there was a decline from the previous year (2013). Nationally, Asian retirement income generally increased in the four years by $3,163 to earn $25,555 by 2014.
California Korean retirement income decreased by $1,084 during the four years to be $21,920 in 2014. Asians, on the other hand, gained the highest increase by $3,835 and earned $26,385 in 2014.
Retirement income for Koreans in Los Angeles County decreased by $2,091 until 2014 where Koreans earned a mean retirement income of $17,528. Though Asians in Los Angeles County also experienced a similar increase by $3,671, they earned a mean retirement income of $25,593 in 2014. Korean retirement income decreased the most in Los Angeles city by $11,025 since 2010. By 2014, the mean retirement income for Koreans in Los Angeles was $12,792. Retirement income for Koreans in Los Angeles city increased by $558 during the four years to $22,203 in 2014
MEAN CASH PUBLIC ASSISTANCE INCOME GROWTH FROM 2010-2014

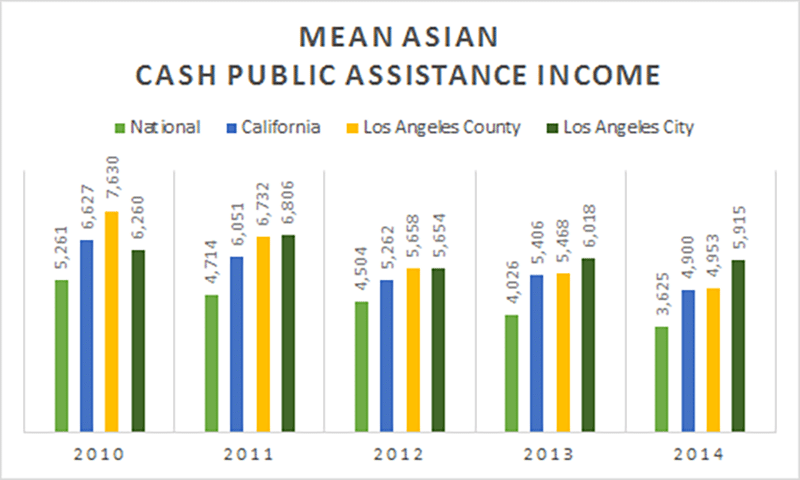
Cash public assistance income for Asians on the National and Los Angeles County scale has dropped within the past four years. Funding in Los Angeles city, on the other hand, has steadily increased since 2010. Asian cash public assistance income generally was lower than their Korean counterparts, $9 more than Koreans nationally, and $1,000 lower than Koreans on all other levels.
Koreans on the national scale decreased by $1,277 from 2010, earning a mean cash public assistance income of $3,616. Asian cash public assistance income also experienced a decrease of $345 during the four years, earning an income of $5,915 by 2014.
Californian Korean cash public assistance income decreased by $578 from 2010. By 2014, Koreans in California earn a mean cash public assistance income of $5,947. Asians in California also experienced a decrease in cash public assistance income by $1,727, earning $4,900 by 2014. Cash public assistance income for Koreans increased the most in Los Angeles County by $1,272 to earn $6,921 by 2014. On the other hand, cash public assistance income for Asians in Los Angeles County decreased the most by $2,677 to be $4,953 in 2014. Korean cash public assistance income in Los Angeles city increased by $1,106 to be $7,529 in 2014. Asian cash public assistance income in Los Angeles city decreased by $345 to be $5,915 in 2014.
Tables and Graphs
Source: U.S. Census Bureau, 2010-2014, Community Service Estimates
CONCLUSION
Last Updated August 2020
According to the 2012 Survey of Business Owners, there are 2,177 Korean small businesses in California alone. The Census Bureau also reports that 42.9% of small businesses in California reported a large negative effect by COVID-19. Even attempts to alleviate the negative effect, such as the Paycheck Protection Program (PPP), an SBA loan that helps small businesses keep their workforce employed during the COVID-19 crisis, has been largely unhelpful to Asian-Americans. The Center for Responsible Lending (CRL) has found that 75% of Asian owned businesses “stand close to no chance of receiving a PPP loan through a mainstream bank or credit union”.
From the US Census Data, we can see that Koreans living in the US have a poverty rate of 11.8%. Out of this rate, 18.6% are 65 and older. This means that resources need to be intersectional to be income-sensitive, and also age-sensitive towards the elderly.
Asian Americans have been present in every area of the pandemic, from being Asian businesses being overrepresented in the hardest hitting sectors, to a high proportion of Asian Americans working in high-contact essential roles. However, in an insight article by McKinsey & Company, data shows that from February to June 2020, Asian American unemployment rates increased by more than 450% due to COVID-19, which points towards a serious rate of unemployment looking at previous patterns of Asian American unemployment. At KAC, we’ve seen first-hand the COVID-19 impacts on high unemployment rates affecting our Korean American community. We’ve experienced a three-fold increase in call volume and handled 94 conciliation cases through our Mediation department. Despite being one of the key communities that have been working towards aiding the nation during the pandemic, Asian Americans are seeing negative impacts on their industries and employment.
Recommendations:
- Work towards expanding language assistance to apply and access unemployment benefits via phone/online [Unemployment Insurance, Pandemic Unemployment Assistance, etc.]
- Expand language assistance via phone beyond Spanish, Cantonese, Mandarin, Vietnamese
- Work towards requiring making banks and credit unions accessible and fair, with financial aid allocated specifically for minority-owned businesses
- We strongly support more government-led initiatives for in-language loan education classes to the general public. KAC and many other Korean American organizations do not have the expertise to take in loan applications and respond to loan inquiries.
- Provide in-language protocol to reopen businesses in a safe manner
Sources:
- Center for Responsible Lending: The Paycheck Protection Program Continues to be Disadvantageous to Smaller Businesses, Especially Businesses Owned by People of Color and the Self-Employed
- US Census Data: 2012 Survey of Business Owners
- US Census Data: 2018 American Community Survey
- McKinsey & Company: COVID-19 and advancing Asian American recovery
First Publication Date: August 2017.
Written and Compiled by: Janet Kang, Susan Joh, and Sophia Shin
Updated August 2020.
Written and Compiled by: Elisa Sue Young Park
Reviewed by: Esther Jung, Sophia Shin
