The following contains graphs and tables from the U.S. Census Bureau regarding language proficiency levels and educational attainment among the Korean and Asian population in the United States. Data from the years 2010-2014 were used to analyze the two populations on the national, state, county, and city level. Language proficiency was measured by the estimated percentage of people ages five and up in each population who self-evaluated their English abilities as “English only”, and for those who speak another language besides English as speaking English “very well” or “not very well”. Education was measured by the highest level of education received and reported for people ages twenty-five and up.
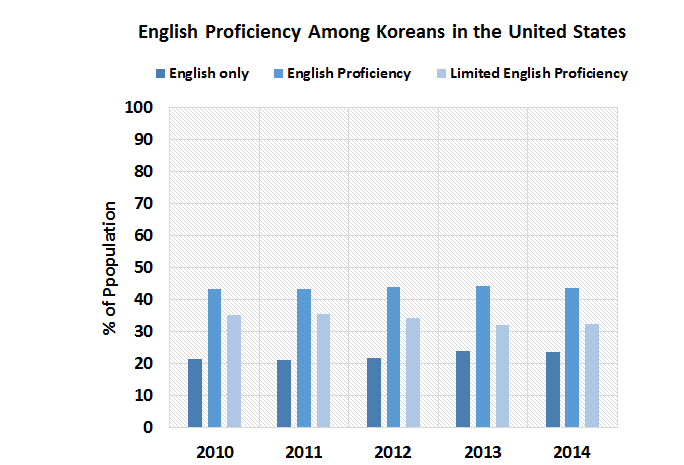
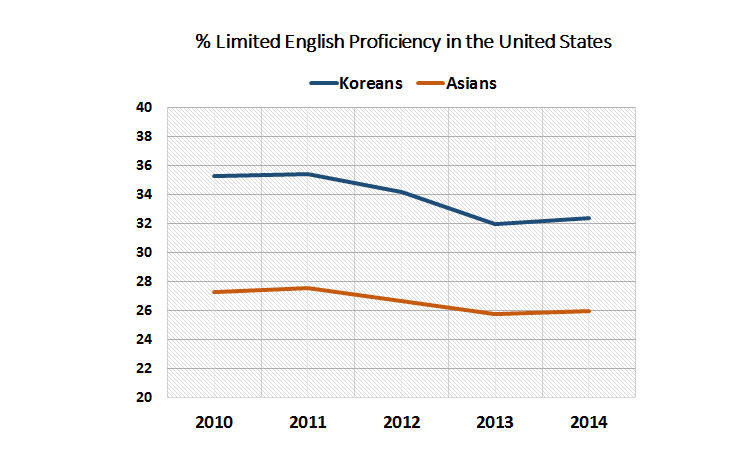
The percentage of Koreans who speak only English seems to be on an upward trend, from little more than 21% to nearly 24%, an approximate 3% rise, between 2010 and 2014. The portion of the Korean population with English Proficiency (EP, speaking English “very well” and speaking another language) has remained more constant at about 43-44%. In line with the upward trend in Koreans who speak only English, the percentage of Koreans who have Limited English Proficiency (LEP, speaking English less than “very well” and speaking another language) seems to be decreasing over time. From 35.3% in 2010 to 32.4% in 2014, an approximate 3% decrease, with relatively consistent reductions from year to year, the percentage of Koreans who have difficulty with English seems to be reducing over time.
Similar to the trends visible in EP among Koreans in the US, the trends in EP among Asians in the US are of a rising percentage of English-only speakers, a relatively unchanging percentage of EP speakers, and a decreasing percentage of LEP speakers. However, the percentage of EP Asians hovers around 49% as compared to the lower 43-44% among the EP Koreans. In addition, the percentage of Asians with LEP decreased from 27.3% in 2010 to 26% in 2014, with a similar trend to that of the percentage of Koreans with LEP, though the percentage of LEP is noticeably smaller in the Asian than in the Korean community.
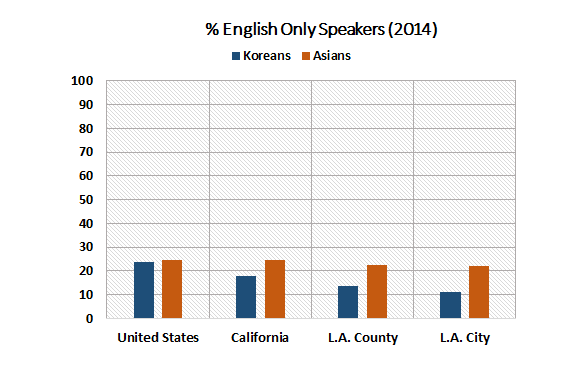
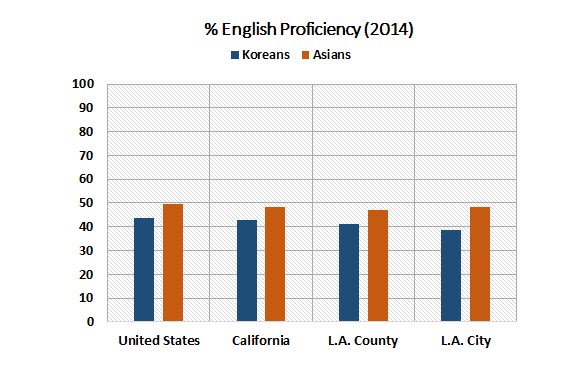
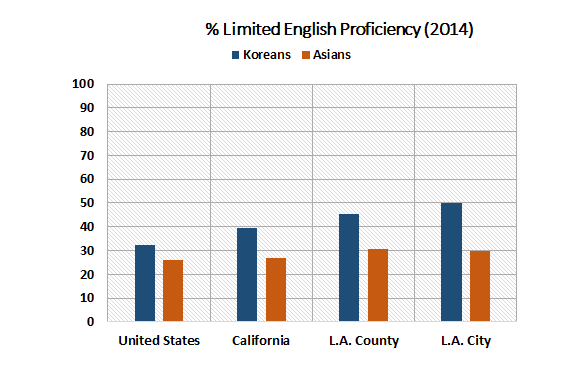
The percentage of people with limited English proficiency increases from the level of the US to California to LA County to LA City. The percentage of the population that speaks English “less than very well” (LEP) seems to be higher for Koreans, especially at the Los Angeles city level, which has 50% LEP. The Asian population nationally is made up of 25% LEP speakers, but 30% LEP speakers at the City of Los Angeles level, which is a little more than half of the percentage of LEP speakers for Koreans in the City of Los Angeles (50%).
LEP in the US, both for Asians and Koreans, seems to be decreasing in recent years. The percentage with LEP in the Asian population is about 10-15% lower than in than the Korean population. The Asian population has had about 26-28% LEP and the Korean population has had about 32-35% LEP. It appears that Koreans, nationally, are more likely to have LEP.
Education
Higher Education Levels in the United States: Korean Population
| Population 25+ | % Some College or Associate’s | % Bachelor’s | % Grad or Prof | |
|---|---|---|---|---|
| United States | 1,063,691 | 20.2 | 34.8 | 19.6 |
| California | 358,284 | 20.5 | 38.8 | 18.6 |
| Los Angeles County | 170,795 | 21.7 | 39.9 | 14.2 |
| Los Angeles City | 92,498 | 23.3 | 38 | 14.6 |
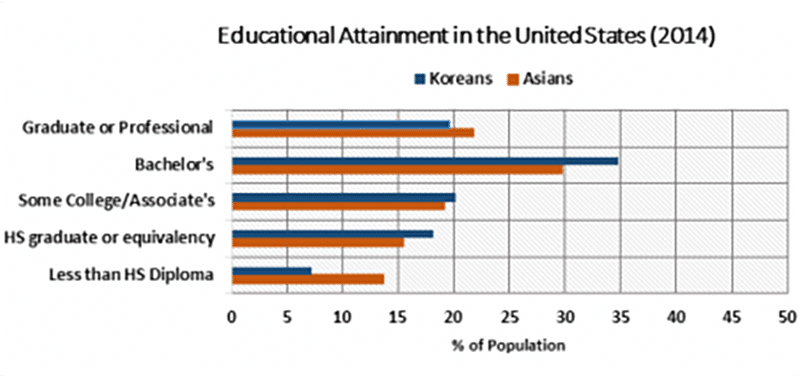
Data from the U.S. Census Bureau shows that over half of the Korean population aged 25 and up, whether on the national (US), state (California), county (LA), or city (LA) level, had a bachelor’s degree or higher in 2014. Nationally, about 19.6% had graduate or professional degrees, the highest percentage across the levels referenced above.When comparing level of educational achievement for Koreans with that of the Asian population in the United States, there is a difference of approximately 5%, in which a higher percentage of Koreans have a bachelor’s degree as their highest level of education. A higher percentage of Asians than Koreans, however, are estimated to have graduate or professionaldegrees as their highest level of education.
From 2010 to 2014, the percentage of Koreans with less than a high school diploma in the City of Los Angeles remained higher than those of the national, state, or county levels. About 8-10% of the Korean population ages 25 and up in the City of LA report having less than a high school degree. While this percentage started to decrease in 2012, there has been a slight increase since 2013. The same applies to the total population of LA county. For the state and national level, however, there has been a steady, relatively constant percentage of Koreans with less than a high school degree from 2010 to 2014.
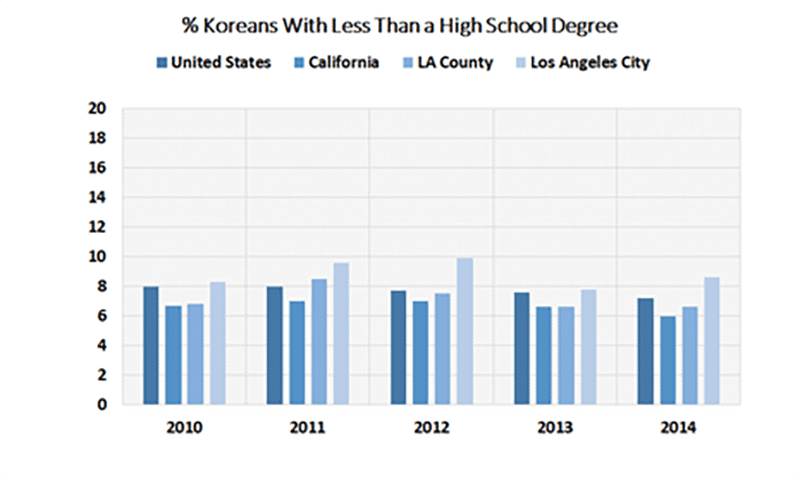
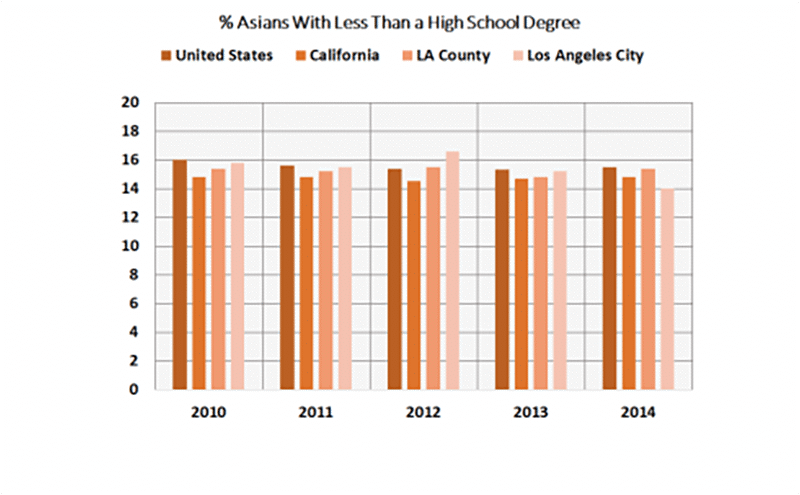
The percentage of Asians with less than a high school degree is higher overall when compared with the percentage of Koreans without a high school degree. The amount generally ranges from about 11-15% of the Asian population, compared to the smaller 6-10% of the Korean population. Interestingly enough, the percentage of those with less than a high school degree in the Asian community is more significant in the United States than in the population in the City of Los Angeles, which is the opposite of the case in the Korean community. The Asian community has seen an overall decrease in the percentage of people with less than a high school degree.
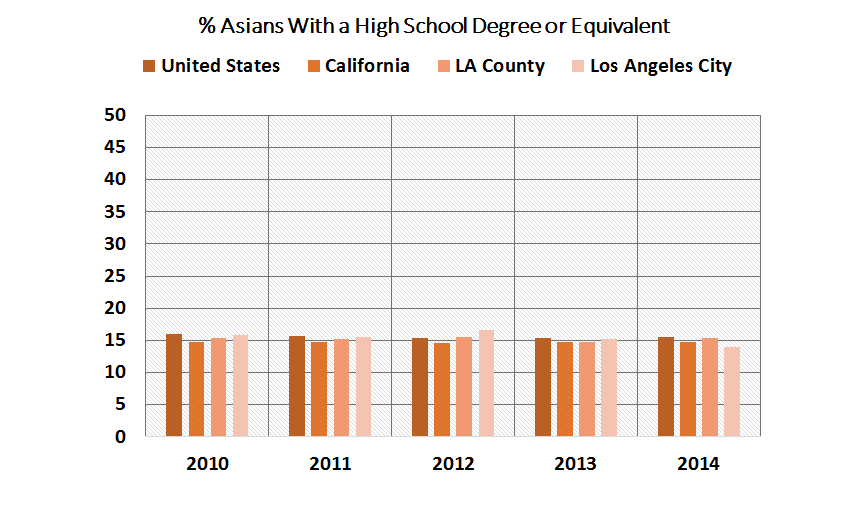
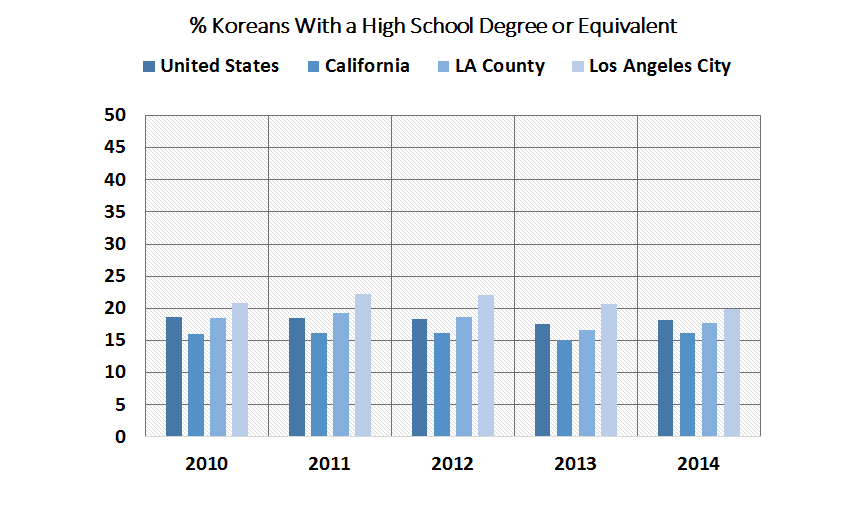
The percentage of Koreans with a high school degree in L.A. city is higher than that of Koreans in the national, state, and county level. However, there has been a slight decrease in that percentage from the year 2012 onwards, which is opposite to what has been happening in the national, state, and county level during the years 2013-14. As of 2014, the estimated percentage of those with a high school degree is 15-20%. The percentage of Asians with a high school degree is similar throughout the national, state, county, and city level. However, like the Korean population, those with a high school degree in Los Angeles city has decreased over time, starting from the year 2012 onwards. The estimated percentage of Asians with a high school degree is 14-16%, with many overlaps throughout the national, state, county, and city levels.
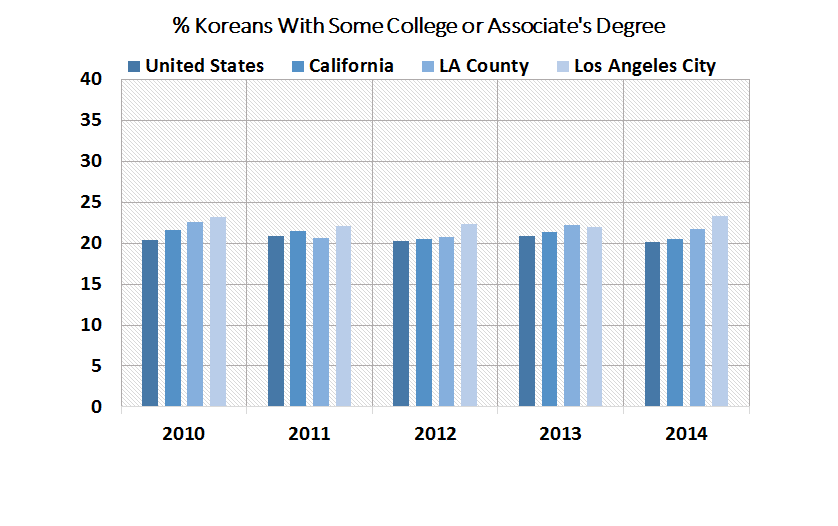
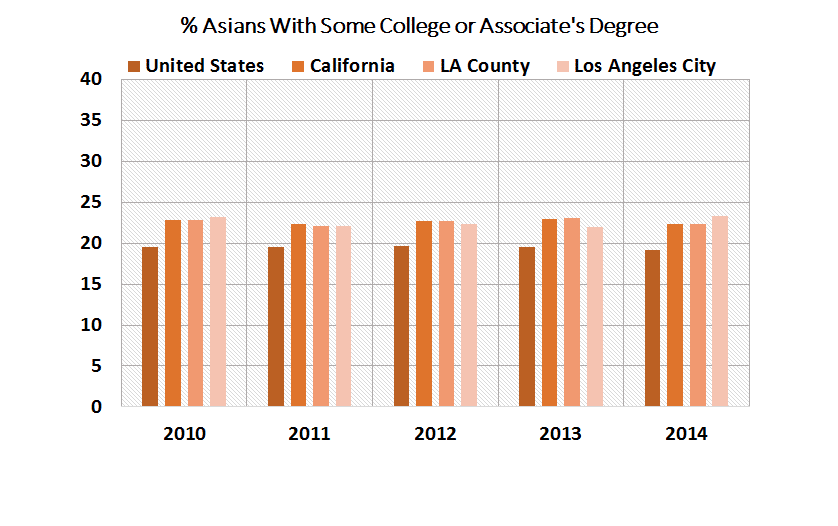
The percentage of Koreans with some college or associate’s degree ranges from about 20-24% throughout the national, state, county, and city levels. The City of Los Angeles has a higher percentage (23-24%), while LA county, California, and the United States follow close behind, with no major difference.The percentage of Asians with some college or associate’s degree ranges from 19-23% throughout the national, state, county, and city levels. The United States appears to have the least amount of Asians with some college/associate’s degree (19%), while the state, county, and city levels continue to circle around 23% throughout the years. Overall, the Asian count seems to be slightly less than the Korean count for those who have achieved some college, or have gained an associate’s degree.
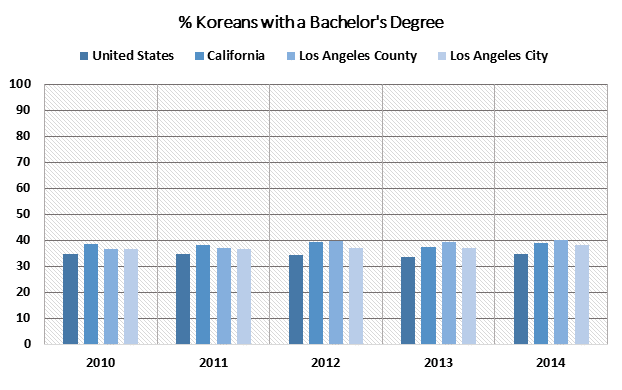
The percentages for the Korean population show little to no change from 2010 to 2014, or across the national (United States), state (California), county (Los Angeles), and city (Los Angeles) levels. The percentage of Koreans with a bachelor’s degree is lower on the national level than it is on the state, county, and city level, but the percentage is around the same–around 35-40% There is an overlap in the percentages in the state and county level. While California experienced a dip in the percentage of Koreans with bachelor’s degrees in 2013, LA county is estimated to have surpassed California in 2012. There seems to be more Koreans with a bachelor’s degree living in Los Angeles County.
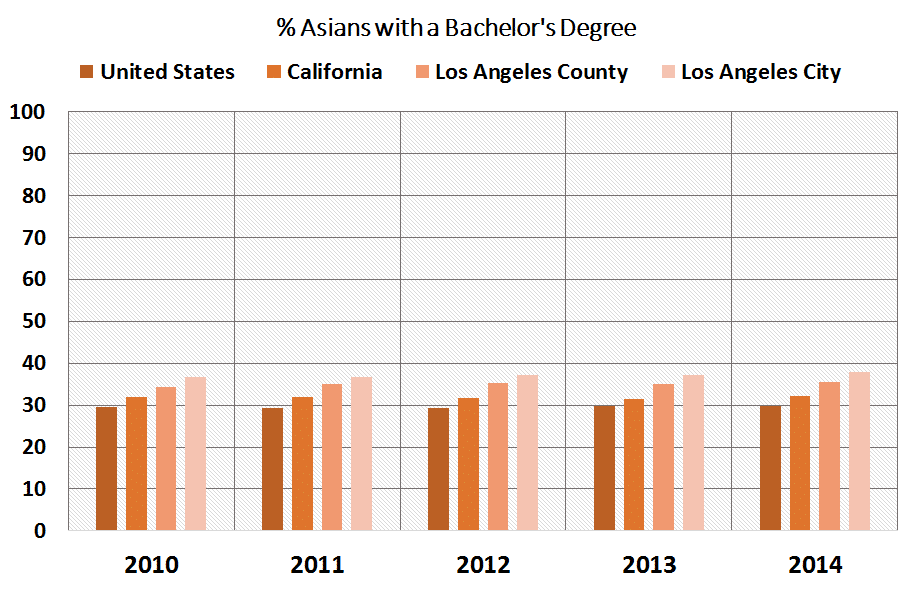
The percentage of Asians with a bachelor’s degree is similar to the percentage of Koreans with the same, in that all four levels from national, state, county, and city fall under the 30%-40% range. However, the percentages for each of the four levels never overlap–about 30% of the Asian population in the United States have a bachelor’s degree, 32% for California, 35% for LA county, and 36% for the City of LA. The City of Los Angeles has a greater percentage of Asians with a bachelor’s degree. Overall, there is a slow increase from the years 2010-14. (Source: US Census Bureau, 2010-2014 American Community Survey 1-Year Estimates, Table S0201)
*Tables and Graphs Source: US Census Bureau, 2010-2014 American Community Survey 1-Year Estimates, Table S0201
CONCLUSION
The percentage of limited English proficiency (LEP) among the Korean population is notably higher in Los Angeles County than in the United States as a whole. Since the reported 2014 Census data, the 2018 Census data shows an upward trend for the LEP percentage at all levels, from 25% nationally in 2014 to 39.5% in 2018. In line with the upward trend, Koreans are also more likely to have higher LEP percentages than the relative Asian population at all levels. At the Los Angeles County level; there is a significant 13.8% difference between the Korean LEP percentages and the Asian LEP percentages as noted in the data with 37.8% of Asian’s with LEP compared to 51.6% of Koreans.
In addition, the percentage of Koreans with some college/associate’s degree, with a bachelor’s degree, and those with graduate/professional degrees exceeds those of the average US population percentages at all levels. Comparing educational attainment of the Korean population to the general Asian population, the percentages vary slightly from region and from level of education. However, we have found no significant difference between the higher education attainment levels between Koreans and Asians at a national, statewide (CA) and county level (LA County). The largest differences found in the data was for bachelor’s degree attainment; attainment of a bachelor’s degree among the Korean population was 5.1% greater than among the larger Asian population on the national level, 5.6% greater on the state level (CA) and 3% greater on the county level (LA County). Overall, Koreans seemed slightly more likely to have attained a bachelor’s degree than the larger Asian population at all levels.
As well, there are no major changes between educational attainment for the Korean population between the Census data from 2014 and the Census data from 2018. Again, the percentages at all levels and regions differed by 3% or less. The largest change found was a 3% increase in Korean graduate and professional degrees between the 2014 Census data on the national level.
However, we see a significant gap in academic performance for English Language Learners (ELL), which includes the large percentage of Koreans with LEP in LA County (51.6%). The high school graduation rate for ELL students is 20% lower than the larger U.S. rates, while they are “three times less likely to be placed in gifted programs than their English Proficient (EP) peers, five times less likely to take advanced placement (AP) courses, and four times less likely to take college preparatory exams” (Lee). This underperformance by ELL students is likely related to the severe lack of funding for language acquisition programs and a shortage of ESL-qualified teachers. Hence, a mere 2.5% of teachers serving ELL students hold degrees that include any ELL/multilingual education, and more than half of the country is in need of more ESL-specific educators. Thus, KAC highly recommends a significant increase in ESL funding in order to incentivize more ESL teachers.
Recommendations:
While it is not yet clear that people with limited English proficiency are more likely to contract COVID-19, it is imperative that this group is not disproportionately affected because of their English skills. As of August 5th, 2020, Asian residents made up only 2.7% of cases in LA County but 14.8% of total deaths. Hence, only 2.6% of those tested in LA County are Asian residents. In the context of COVID-19, the need for equitable access to multilingual resources is critical in areas with high concentration of LEP populations. Since more than half of the Koreans in LA County are LEP, we recommend expanding the language services in the healthcare system and creating stronger partnerships with community organizations and the government. In addition, the insufficient Korean-language (and multi-Asian language) for COVID-19 resources can hinder the accessibility to testing facilities and information because testing resources that are English-language only discourage this huge population of Koreans with LEP to take the proper testing measures, which subsequently undercuts their case count. KAC recommends the increase in testing sites that provide Korean-speaking test distributors and resources like Korean language COVID-19 guides.
TABLES
Educational Attainment (Asian Population)
| Region | Population (25+ years) | College / Associate’s | Bachelors | Grad / Prof |
|---|---|---|---|---|
| United States | 13,111,463 | 18.2% | 30.7% | 24.3% |
| California | 4,301,272 | 21.5% | 33.2% | 20.1% |
| Los Angeles County | 1,144,344 | 21.2% | 36.9% | 15.9% |
Educational Attainment (Korean Population)
| Region | Population (25+ years) | College / Associate’s | Bachelors | Grad / Prof |
|---|---|---|---|---|
| United States | 1,118,233 | 18.2% | 35.8% | 22.6% |
| California | 367,438 | 19.9% | 38.8% | 20.1% |
| Los Angeles County | 173,572 | 20.4% | 39.9% | 14.7% |
Educational Attainment (U.S. Population)
| Region | Population (25+ years) | College / Associate’s | Bachelors | Grad / Prof |
|---|---|---|---|---|
| United States | 223,158,847 | 28.9% | 20% | 12.6% |
| California | 26,815,644 | 28.8% | 21.3% | 12.9% |
| Los Angeles County | 6,957,176 | 26.2% | 21.3% | 11.2% |
Language Spoken at Home (Asian Population)
| Region | Population (5+ years) | English only | Language Other than English | Speaks English “less than very well” ie Limited English Proficiency |
|---|---|---|---|---|
| United States | 17,498,512 | 26.1% | 73.9% | 31.6% |
| California | 5,549,344 | 26.2% | 73.8% | 33.2% |
| Los Angeles County | 1,427,078 | 24% | 76% | 37.8% |
Language Spoken at Home (Korean Population)
| Region | Population (5+ years) | English only | Language Other than English | Speaks English “less than very well” ie Limited English Proficiency |
|---|---|---|---|---|
| United States | 1,420,694 | 27.2% | 72.8% | 39.5% |
| California | 452,219 | 21% | 79% | 45.1% |
| Los Angeles County | 207,011 | 15.4% | 84.6% | 51.6% |
* Sources:
