This section will cover the housing and health data gathered from the American Census Bureau, from the years 2010 to 2014. The two populations covered are ethnic Koreans and Asians in the city of Los Angeles, the county of Los Angeles, California, and the United States. The housing category encompasses the data regarding the trends of ownership, such as the difference between homeowners and renters, as well as the different family household types of the two populations. The health category encompasses the data regarding the trends of health insurance coverage, the percentages of Koreans and Asians that are covered by health insurance, and the comparisons of public and private health insurance coverage.
HEALTH INSURANCE
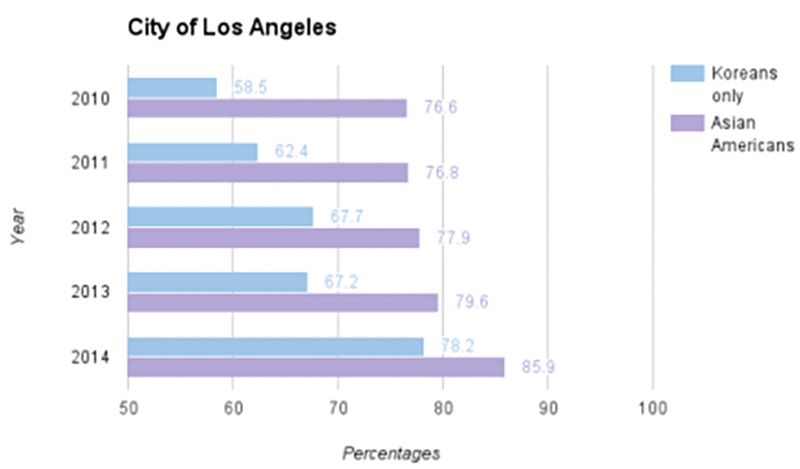
The percentage of insured Koreans fluctuates each year, ranging from 64.3% to 70.9% — however, the percentage drops nearly 8% in 2014. There is a gradual increase of insured Asians from 2010 to 2013, but there is almost a 6% increase in 2014. Compared to the overall percentages of insured Asians throughout 2010-2014, the overall percentages of insured Koreans are nearly 20% lower.
There is a gradual increase of insured Asians throughout the years, with a spike in 2014 — the percentage increases by 6.3%. In general, however, the percentages remain stable. From 2010 to 2012, the percentage of insured Koreans increases by at least four percent. In 2013, there was a 0.5% decrease, but the percentage jumped in 2014 by 6.3%. Overall, the percentage of insured Koreans increased drastically. Compared to the Asian population as a whole, Koreans have a lower percentage of being insured.
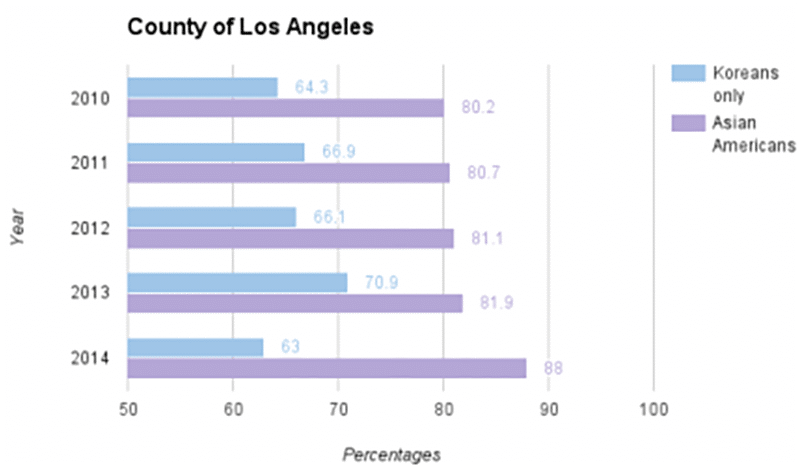
From 2010 to 2012, the percentages of insured Koreans fluctuates. After dropping by one percent in 2012, the percentage increases greatly in 2013, then by nearly 9% by 2014. The trend of insured Asians from 2010 to 2013 is generally stable. However, the percentage of insured Asians rises greatly in 2014, with over a 5% increase.
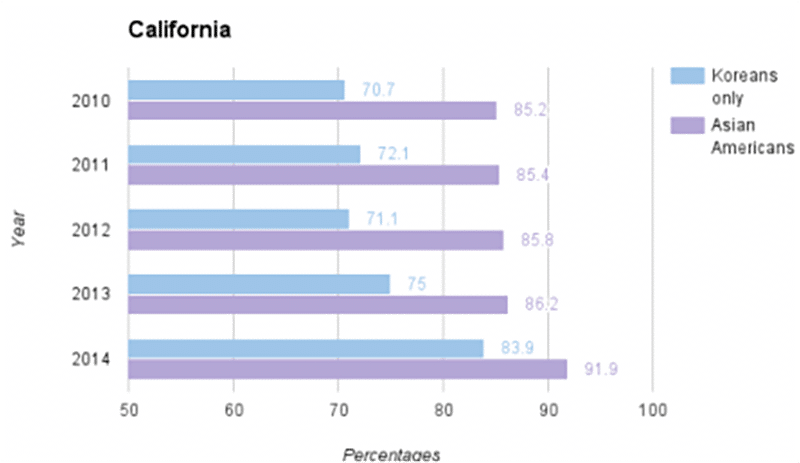
There is a steady increase in the percentage of insured Koreans from 2010 to 2013, with a substantial jump in 2014 by about 6%.
The percentage of insured Asians stayed constant with increases by less than 1%. Similarly to the percentage of insured Koreans in 2014, there was a substantial increase by about 4%.
HEALTH TRENDS
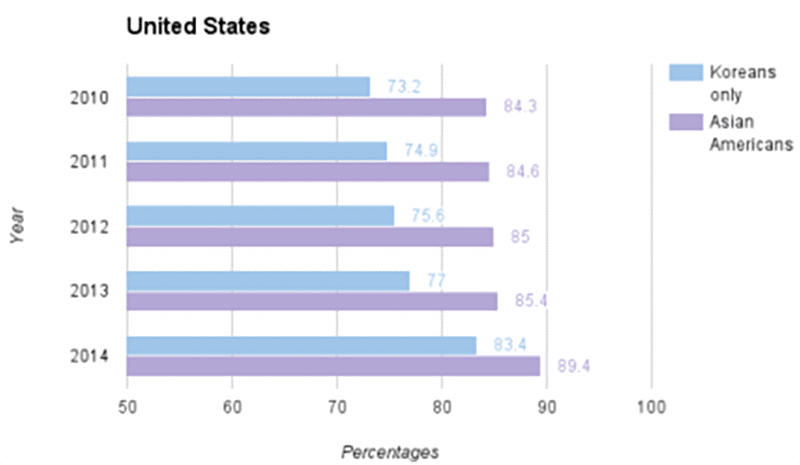
The Asian population in California has higher percentages of having health insurance than the Asian population as a whole population in the United States. However, the percentage of Koreans in the United States with health insurance is higher than the percentage of Koreans in California with health insurance. While there is a general increase in the percentage of Asian with health insurance (LA city, LA county, California, and the United States) throughout the years, the percentage of Korean Americans with health insurance fluctuates yearly on the city, county, and state level. We only see a slight increase in percentage of Koreans with health insurance on the national level. In general, the percentage of insured Asians jumped from 2013 to 2014.
On all levels, the Korean population and the general Asian population are more likely to own private insurance rather than public insurance. There is a general increase in the percentage of privately insured Asians between 2010-2014 on all levels. In contrast, the percentage of privately insured Koreans between 2010-2014 fluctuated on the city, county, and state levels. Up until 2014 on all levels, the percentage of Koreans (if not privately insured) were more likely to not be insured than publicly insured. In 2014, the percentage of those insured through public insurance increased and those not insured dropped. On all levels, the Asian population is more likely to be insured through private insurance rather than public insurance.
PERCENTAGES OF KOREANS HEALTH INSURED (PUBLIC VS. PRIVATE)
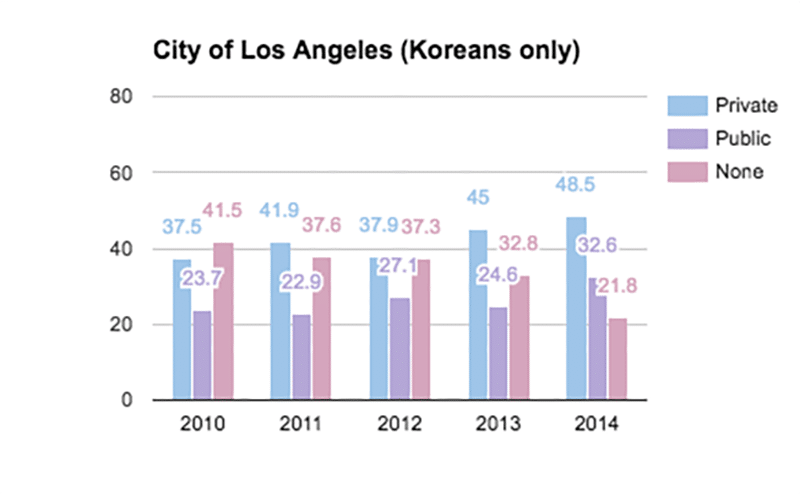
From 2010 to 2014, the percentage of privately insured Koreans fluctuated, with an overall net increase of 11%. Similarly, the percentage of publicly insured Koreans fluctuated, with an overall net increase of 8.9%. The percentage of non-insured Koreans outweighed the individual percentages of privately and publicly insured Koreans in 2010, but decreased by nearly 20% by 2014.
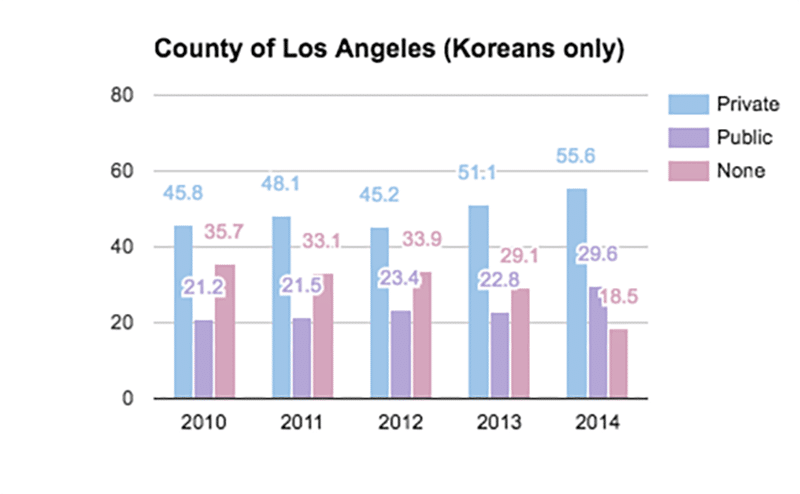
The percentage of privately insured Koreans fluctuated but increased overall from 2010 to 2014, with a net increase of 9.8%. There is a gradual increase in the publicly insured Koreans, with a net increase of 8.4%. The trend for the percentage of non-insured Koreans fluctuates, but there is a general decreasing trend. The net decrease is 17.2%.
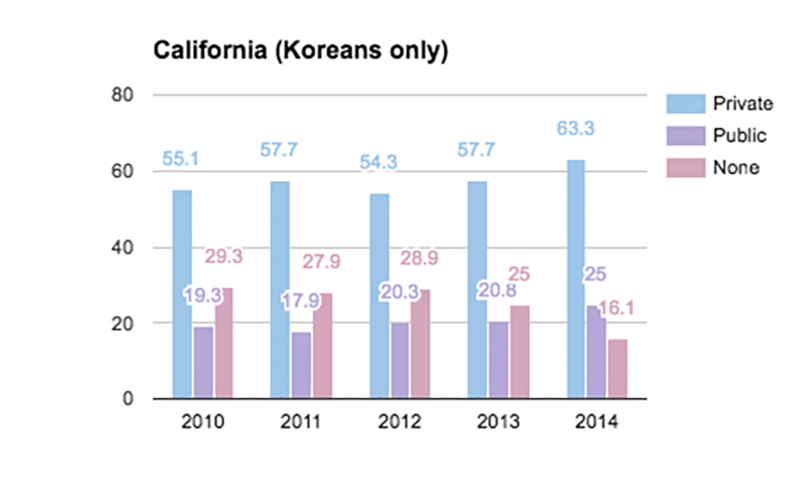
The over half the population of Koreans in California (recorded in the census) are privately insured. Koreans in California are less likely to be publicly insured, but there is a general increase from 2010 to 2014. There is a net increase of 5.7%. There is a decrease in the percentage of non-insured Koreans, with the net decrease of 13.2%.
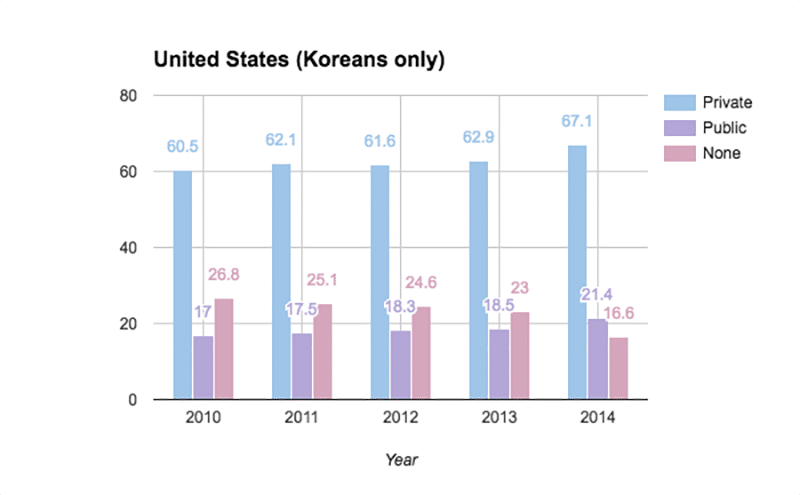
Over 60% of Koreans in the United States are privately insured. There is a gradual increase in the percentage of privately insured Koreans, with a net increase of 6.6%. Similarly, there is a gradual increase in the percentage of publicly insured Koreans, with a net increase of 4.4%. There is a decrease in the percentage of non-insured Koreans, with a net decrease of 10.2%.
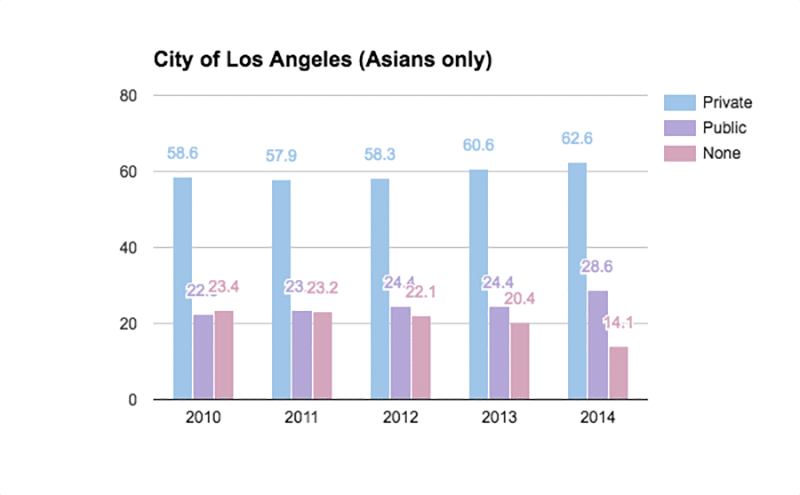
In the city of Los Angeles, there is a slight increase from 2011 to 2014 in the percentage of those with private insurance. In 2014, the percentage of those without insurance was at a low of 14.1%. In 2012 and 2013, the percentage of people with public insurance stayed constant at 24.4% but in 2014, it raised to 28.6%, the highest between 2010 and 2014.
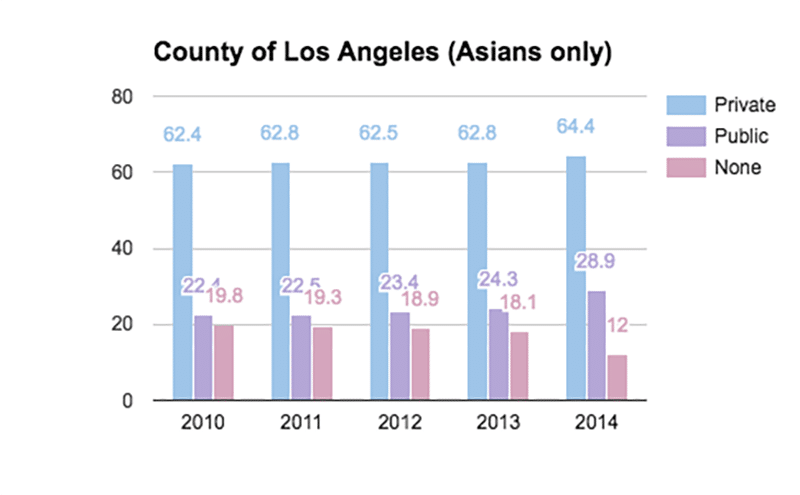
Between 2010 and 2013, the percentage of Asians with private insurance was constantly around 62%, but in 2014, it raised 2% to 64%. In 2014, the percentage of those with public insurance was the highest between 2010 and 2014 with 28.9%. In 2014, the percentage of those with no insurance was at the all time low of 12%.
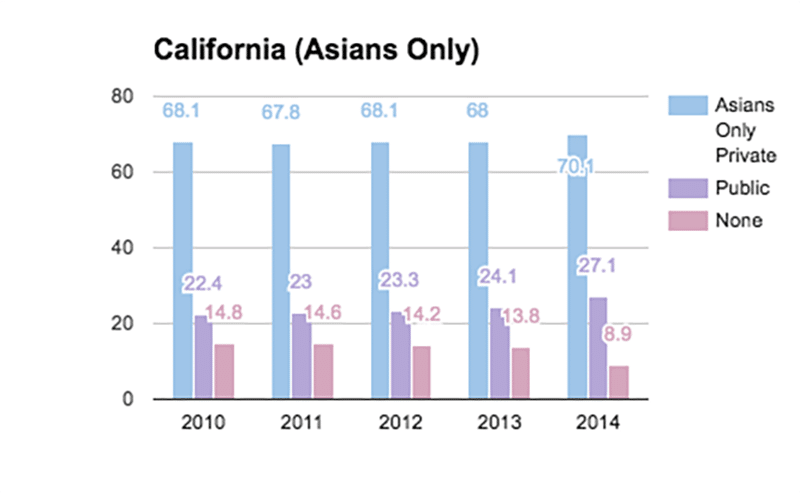
In the year of 2014, the percentage of private insurance was 2% higher at 70.1 compared to the years between 2010 and 2013 with an average 68% of Asians with private insurance. In 2014, the percentage of those without insurance was at a low of 8.9% compared to the 14.8 in 2010.
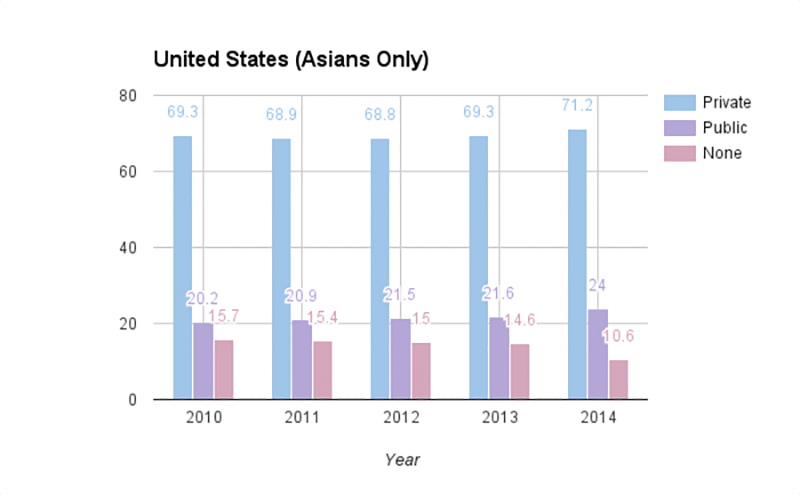
In 2014, there was a percentage of 71.2 of Asians with private insurance, the highest of the years between 2010 and 2013. In 2014, Asians reached the lowest percentage no insurance at 10.6%. Public insurance generally increased between the years of 2010 and 2014.
HOUSING TRENDS
Generally, the Korean population are renters more than they are homeowners. With the Asian population, there are more homeowners in general, with the exception of the city of Los Angeles where the Asian population has more renters than homeowners. Over the years, in the city, state, and nation, the percentage of Korean renters generally stays the same. In the city of Los Angeles, the difference in percentage of Korean homeowners and renters is around 60% from 2010-2014. In the county of Los Angeles, the difference in percentage of Korean homeowners and renters is around 20% from 2010-2014. In the state of California, the difference in percentage of Korean homeowners and renters is around 10% from 2010-2014. In the country of the United States, the difference in percentage of Korean homeowners and renters is about 5% from 2010-2014.
Within households types, there consists family households with biological children under 18, married-couple family with biological children under 18, female householder with no husband present and with biological children under 18. Nonfamily households include male householders living alone and male householders not living alone, as well as female households living alone and female householders not living alone. In all levels both Koreans and Asians have a relatively high percentage of over at least 50% of family households. The percentages of family household types for both Koreans and Asians remained stable over the course of four years from 2010 to 2014.
HOUSING TENURES (KOREANS VS. ASIANS)
Housing tenure refers to the financial arrangements under which someone has the right to live in a house or apartment. The most frequent forms are tenancy, in which rent is paid to a landlord, and owner-occupancy.
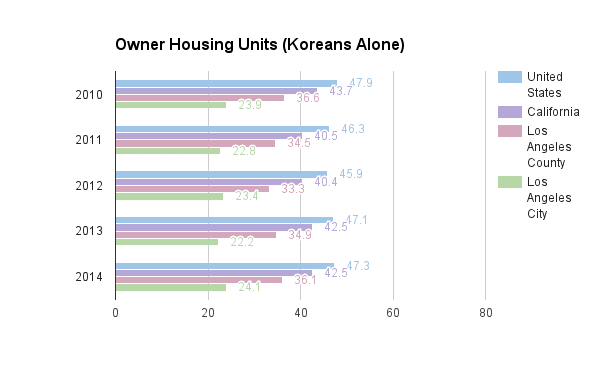
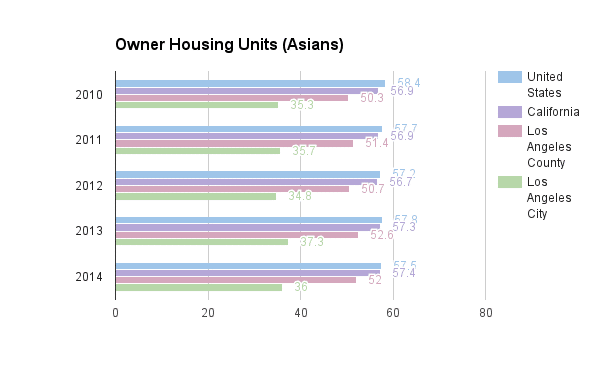
In the year 2012, the owner housing units for Koreans alone declines, but as the year continues, the percentages increase. For Asians only, it generally stays in the 57% range, but fluctuates .2 – .4 from 2010 – 2014. For Asians, the percentages of owner housing units in the United States and in California are generally close to each other.
HOUSING TENURES (CITY HOMEOWNERS VS. RENTERS)
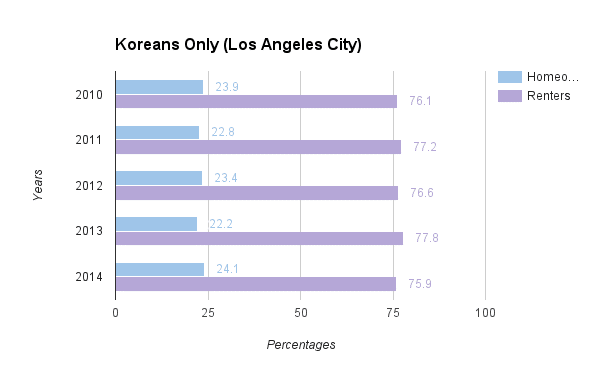
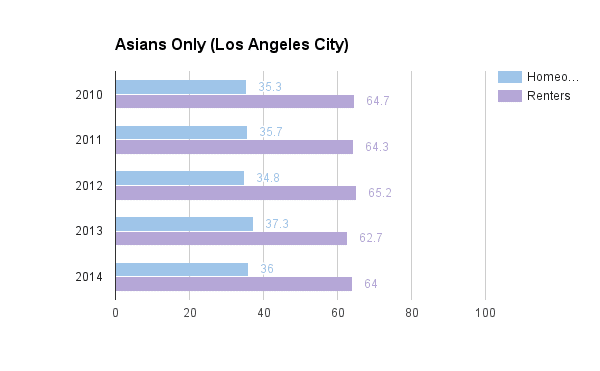
In the city of Los Angeles, there is around a 60% difference between homeowners and renters amongst Koreans. For Asians, there is around a 30% difference between homeowners and renters. For both Asians and Koreans only, there are more renters than there are homeowners.
HOUSING TENURES (COUNTY HOMEOWNERS VS. RENTERS)
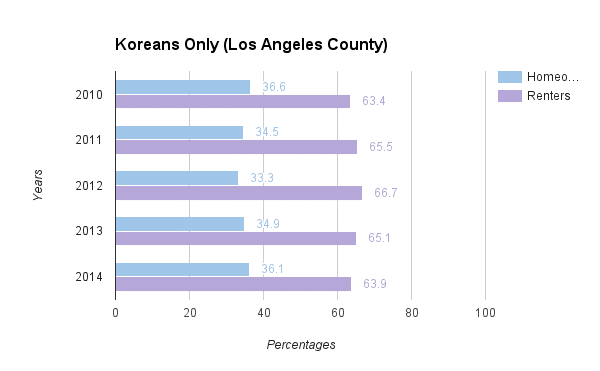
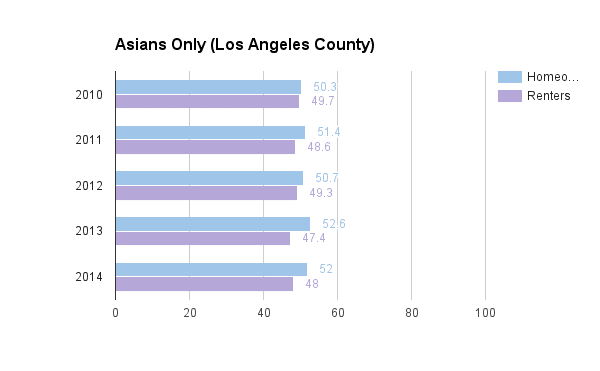
In the county of Los Angeles, there is around a 30% difference between homeowners and renters amongst the Korean population. In 2012, there is a low of 33.3% of homeowners in the Korean population, but the percentage increases in 2013 as well as 2014. In the Asian population, there are more homeowners than there are renters. There is a 1-2% difference between homeowners and renters. In the year 2013, it was the highest percentage amongst homeowners and the lowest amongst renters between the years 2010 and 2014.
FAMILY HOUSEHOLD TYPES
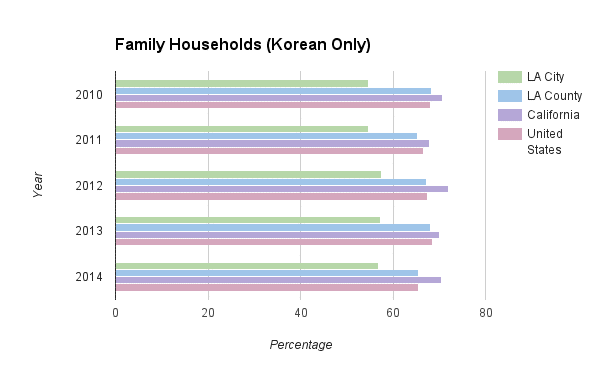
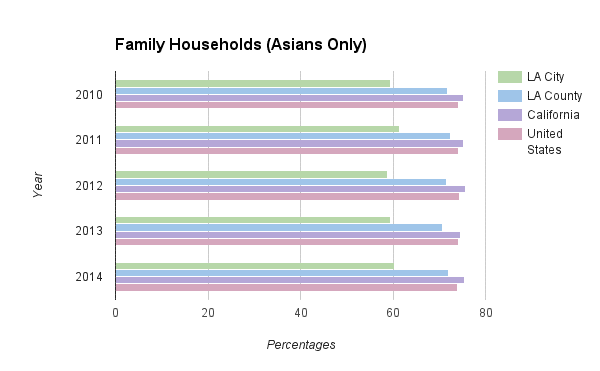

From 2010 to 2014, the percentages are relatively constant. There is a difference of 2.6% between the highest percentage of family households for Asians, which is in 2011, and the lowest percentage, which is in 2012. Similarly, there is only a difference of 2.9% between the highest percentage of family households for Koreans, which is in 2012, and the lowest percentage, which is in 2010. Overall, Koreans have a lower percentage of family households in the city of Los Angeles compared to the general Asian population.
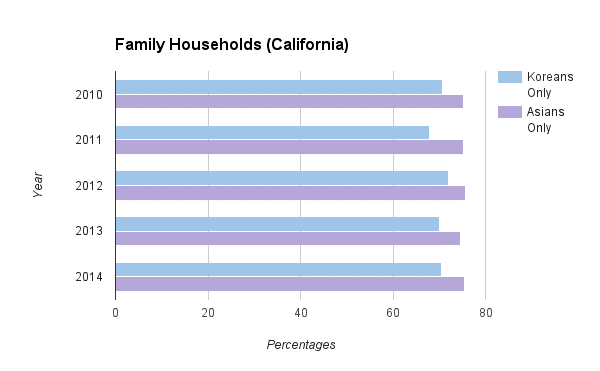
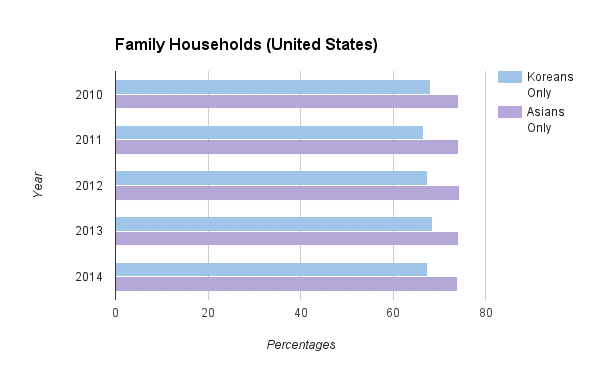
From 2010-2014, the percentages remain relatively stable. There is a difference of 0.4% between the highest percentage of family households for Asians, which is in 2012, and the lowest percentage, which is in 2014. There is a difference of 2% between the highest percentage of family households for Koreans, which is in 2011 and 2013. Overall, Koreans have a lower percentage of family households in the United States compared to Asians.
Tables and Graphs
Source: U.S. Census Bureau, 2010-2014 American Community Study
CONCLUSION
Last Updated August 2020.
Despite Asians in California have higher percentages of having health insurance compared to Asians nationwide, Koreans in California have lower percentages of having health insurance compared to Koreans nationwide. The trend of Koreans in California having lower percentages of having health insurance compared to Koreans nationwide has been consistent from the collection of 2010-2014 data, and still is true using the 2018 American Community Survey. As of the 2018 ACS, 51.6% of Korean housing tenures nationwide are owner occupied, and 48.4% are renter occupied. The 2010-2014 data shows that Korean population was more likely to be renters than homeowners both within California and nationwide, but that has since changed looking at the 2018 ACS, which shows that the Korean population nationwide is more likely to be owners than renters, while the Korean population in California is more likely to be renters than homeowners.In light of COVID-19, 29.5% adults in California who have reported to have missed last month’s rent or mortgage payment, or who have slight to no confidence that their household can pay next month’s rent or mortgage on time. There have been COVID-19 relief efforts on alleviating the struggle that homeowners and renters have been facing, such as Congress passing the CARES Act, but there is a concern that these resources’ reach is limited when it comes to minority group communities.
Recommendations:
KAC recommends that language guides and Korean-language resources be created to help non-fluent Korean-Americans who are facing eviction in their homes in light of COVID-19. Through H.R. 6623, all COVID-19 related materials are required to be translated into a list of languages, Korean included, but KAC recommends for more nationwide bipartisan support on the bill. KAC also recommends additional funding towards Korean-language resource centers and organizations who can help the 7.7% of Koreans who are not insured to find insurance coverage. In addition, KAC supports working towards making banks and credit unions accessible and fair, so that minority-owned households can have proper access to COVID-19 related aid.
Written and Compiled by: Sue Kim, Narin Chung, and Jennifer Eo
Written and Compiled by: Kate Hur
Reviewed by: Esther Jung, Sophia Shin
