This section reveals the trends and analysis revealed by the data collected through surveys from the Census website. We looked at numbers collected from 2007 and 2010 and compared the two data in order to reach conclusions about economic contribution and civic engagement of the Korean and Asian population in the United States.
To measure this, the research was primarily focused on data shown by the Survey of Business Owners in the Census website. This data reveals eight different categories: number of firms with or without paid employees, firms with paid employees, firms without paid employees, sales/receipts of firms with or without employees, sales/receipts of firms with employees, sales/receipts of firms without paid employees, and annual payroll.
ECONOMIC CONTRIBUTION
NATIONAL ECONOMIC CONTRIBUTION OF KOREANS
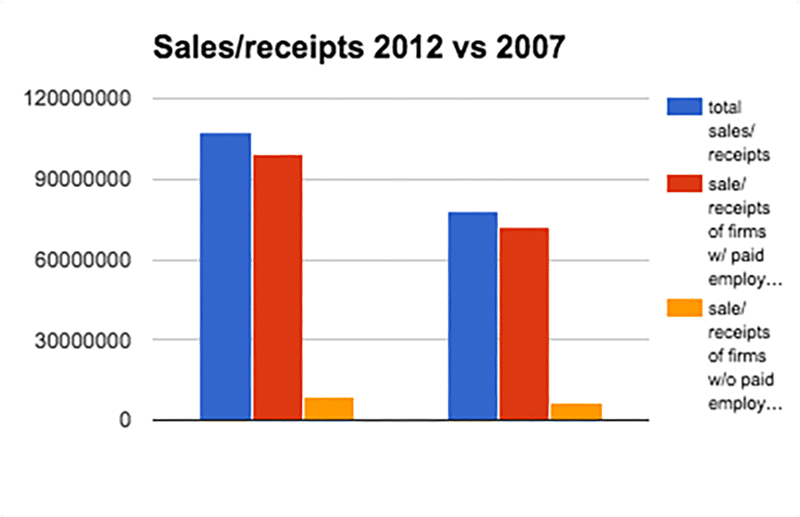
In the graph, the blue indicates the number of firms with or without paid employees, red represents only the firms with paid employees, while the yellow indicates firms without paid employees. Data indicates that the number of Korean owned businesses went up from 192,509 to 224,891, a 16% increase within five years.
ECONOMIC CONTRIBUTION OF KOREANS IN CALIFORNIA
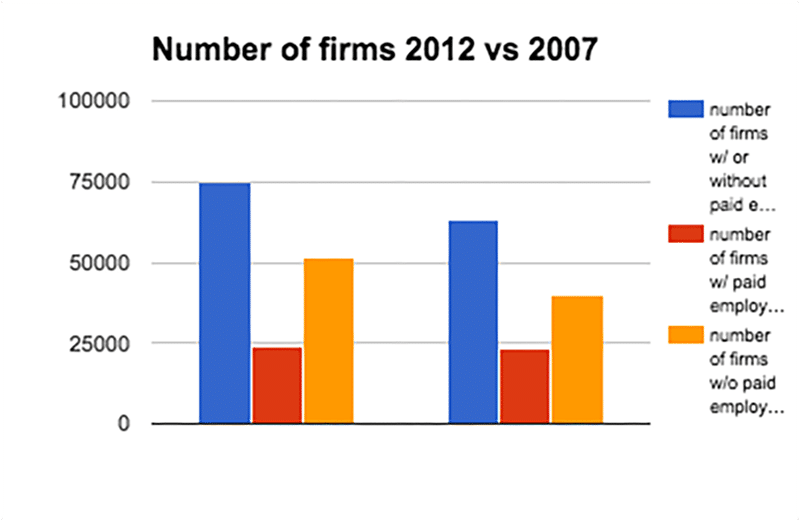
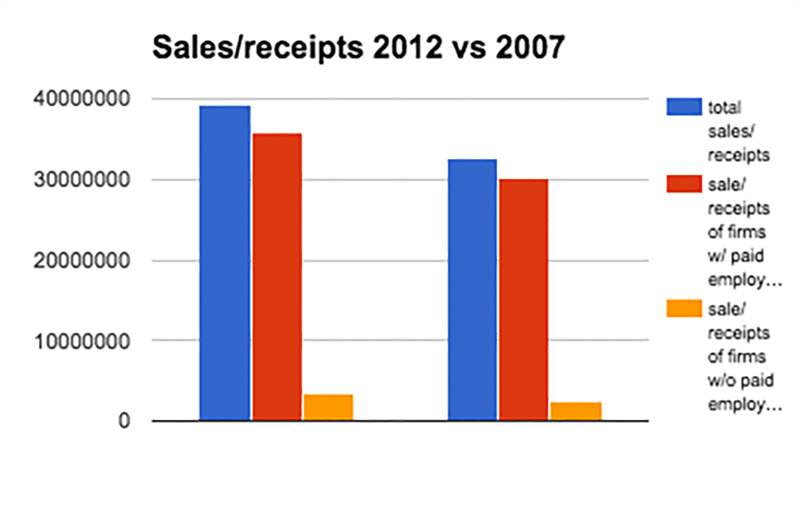
The data of the state California level indicates an increase in both the number of firms, and thus sales/receipts of Korean owned businesses. The number of firms with or without paid employees in the state of California increased from 63,383 to 75,112 which is an 18% increase within five years. The data also indicates that the sales and receipts of Korean owned businesses in Korea increased by over five billion dollars.
ECONOMIC CONTRIBUTION OF KOREANS IN LOS ANGELES COUNTY
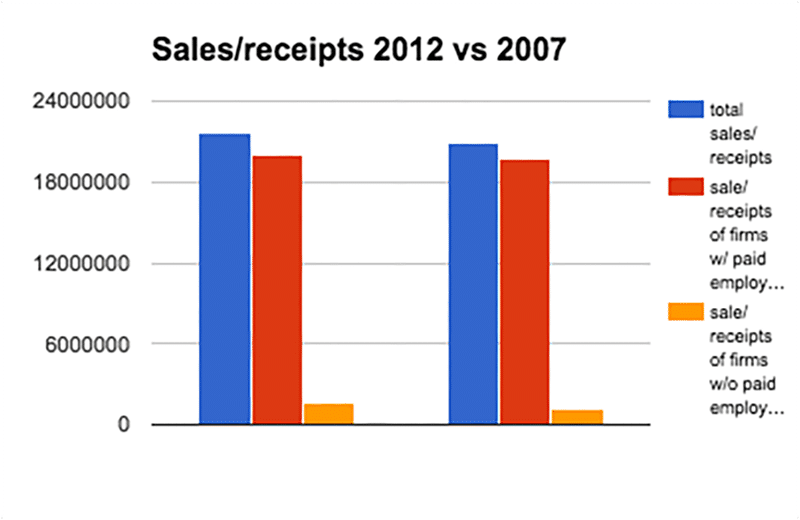
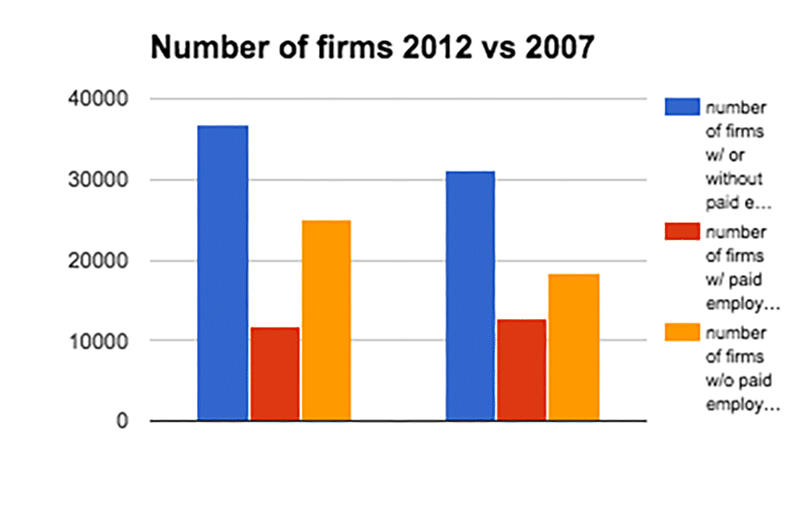
The data of the Los Angeles county level reveals that the number of Korean owned businesses increased from 31,084 to 36,829 within five years, which is also an 18% increase. The sales and receipts data of firms with or without paid employees indicates that nearly a billion dollars increased.
ECONOMIC CONTRIBUTION OF KOREANS IN LOS ANGELES CITY
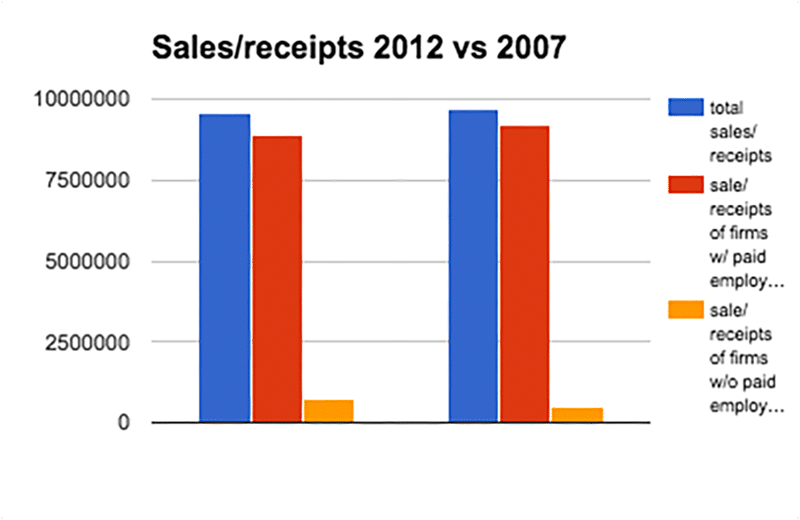
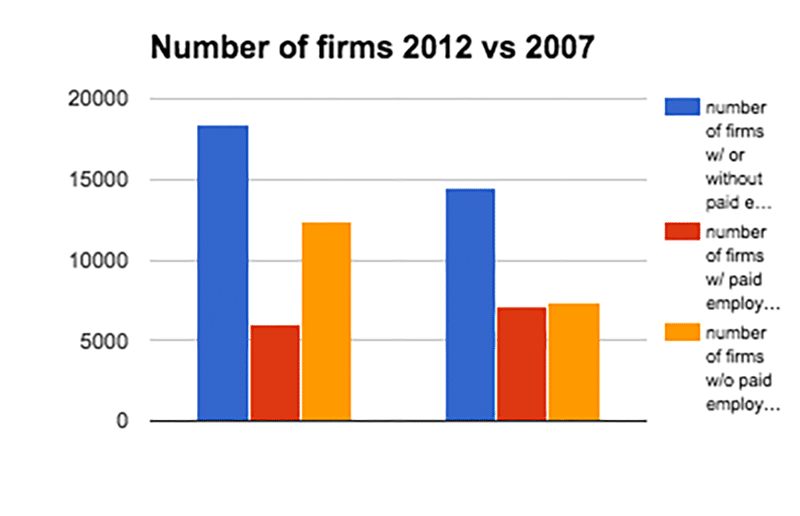
The data from city of Los Angeles revealed the most astounding data, as the graph indicate as well. The number of Korean owned firms increased by 3,891 from 14,490 to 18,381 which is an astounding 27% increase within merely five years. This may be attributed to the fact that Los Angeles (Koreatown and more) has become an extremely popular spot for Koreans to settle in.
ECONOMIC CONTRIBUTION OF ASIANS IN THE U.S.
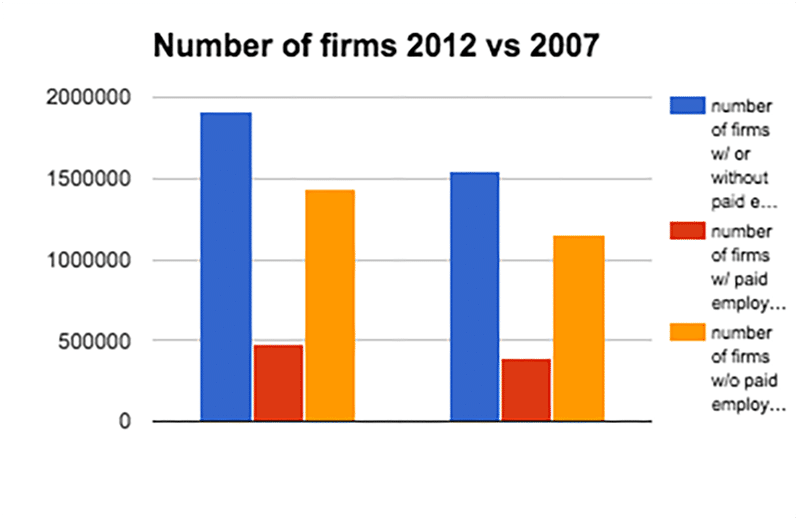
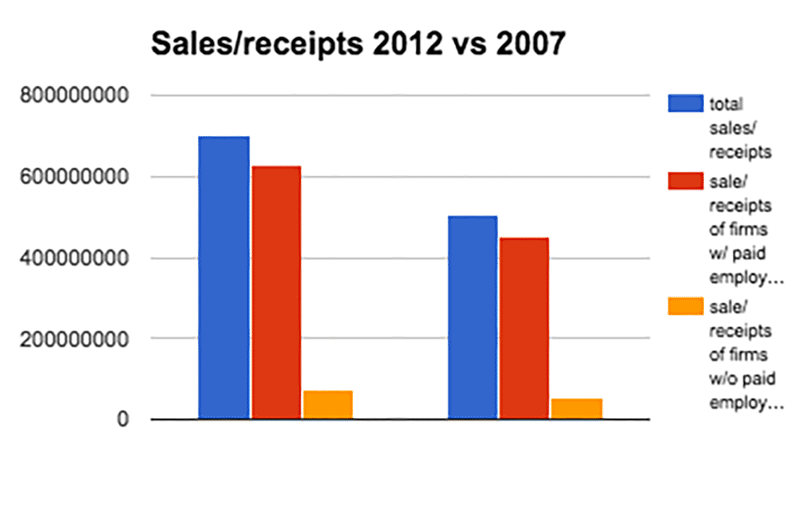
As with the data of the Korean population, the same colors indicate the same categories: the blue shows the number of firms with or without paid employees, red represents firms with paid employees, and yellow the number of firms without paid employees. At the national level, the number of firms owned by Asians increased by 368,343 (1,549,559 to 1,917,902) a 24% increase.
ECONOMIC CONTRIBUTION OF ASIANS IN CALIFORNIA
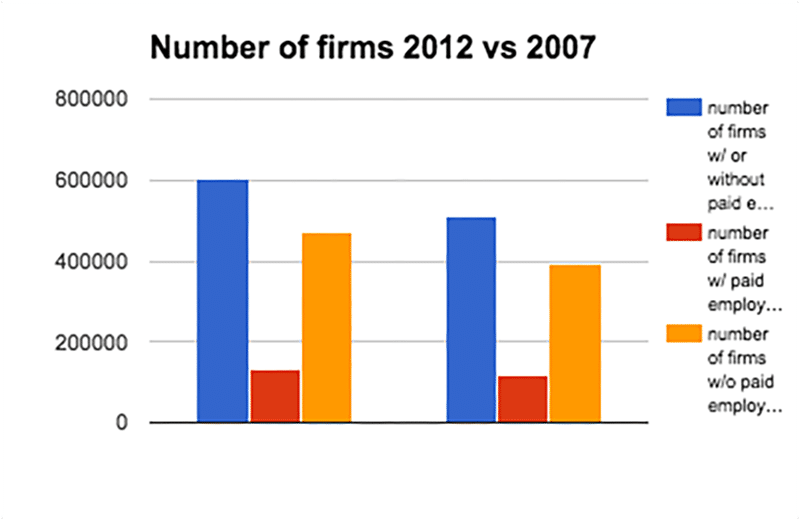
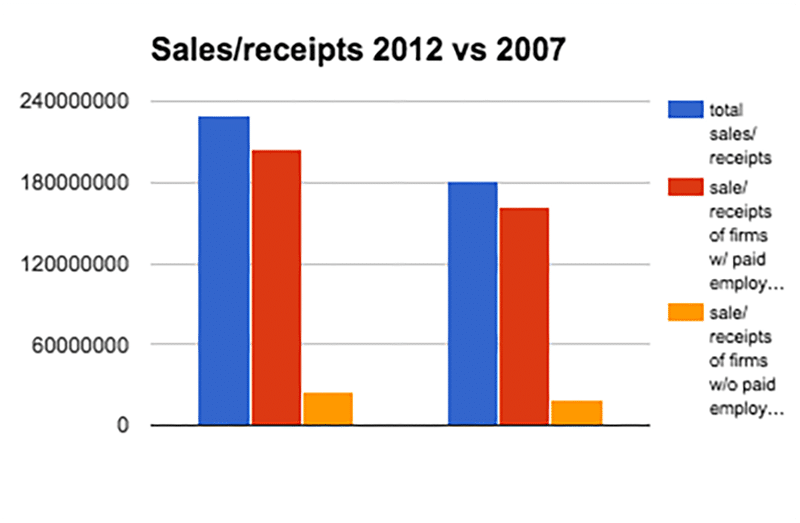
When looking at the data for Asians in California, it see that the number of firms increased by 95,901, an 18% increase within five years. The sales and receipts data also indicate that there was nearly a 50 million dollar increase for firms owned by Asians in California.
ECONOMIC CONTRIBUTION OF ASIANS IN LOS ANGELES COUNTY
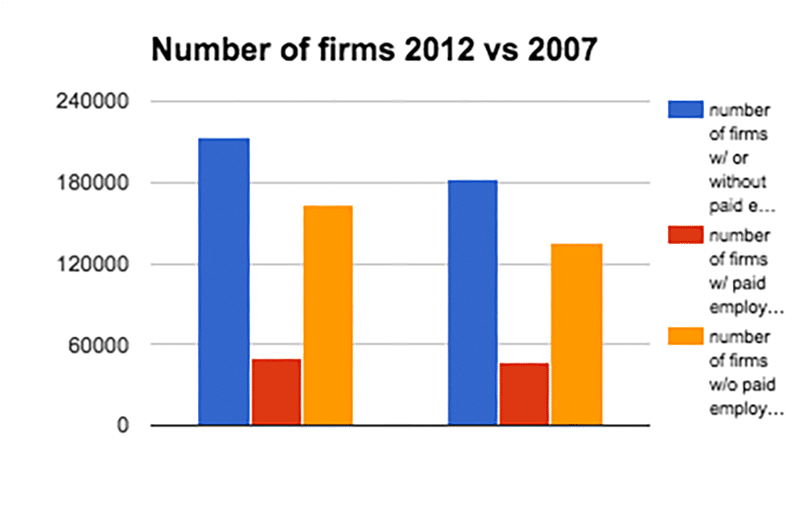

The Los Angeles County data indicates that firms with or without paid employees owned by Asians increased from 183,090 to 213,203. This is a 16% increase within five years. The graphs also indicate that the sales and receipts of the firms increased by about 10 billion dollars.
ECONOMIC CONTRIBUTION OF ASIANS IN LOS ANGELES CITY
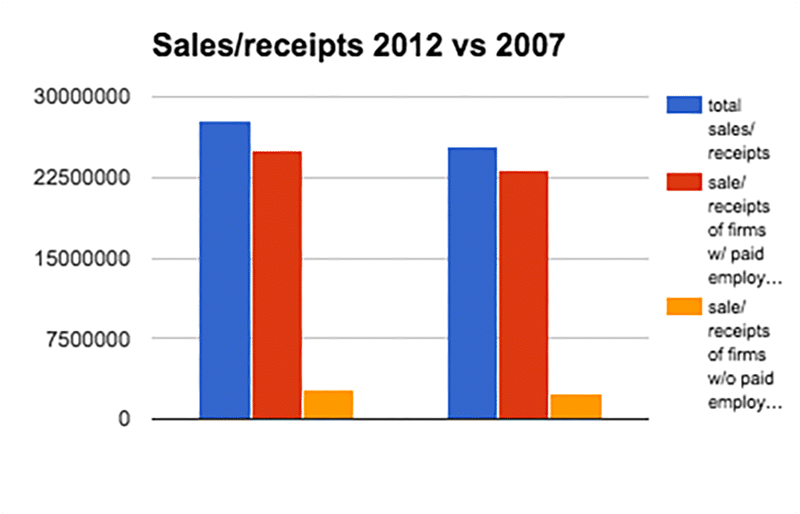
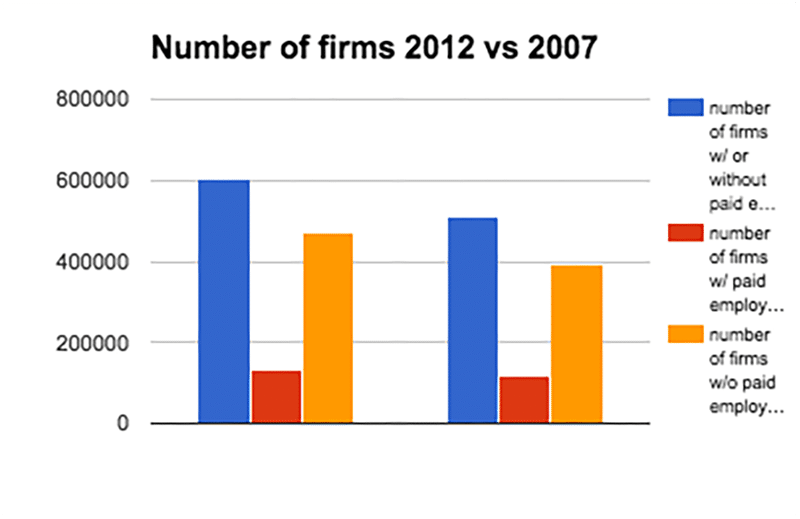
The data for the Los Angeles city indicate that firms owned by Asians have increased from 61,606 to 68,511 during the five years. This is an 11% increase- which is smaller than the percentage of increased businesses of Korean people (which was 27% as indicated before). There was about a 2 billion dollar increase in sales and receipts over the five years.
CIVIC ENGAGEMENT
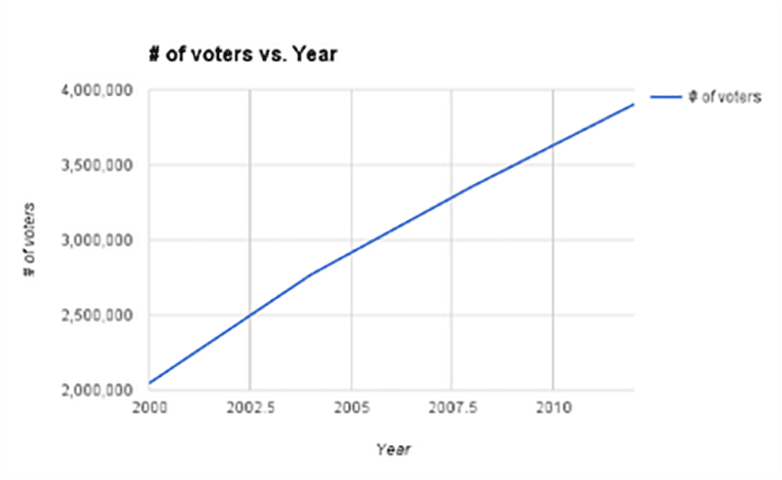
| Year | # of Voters |
|---|---|
| 2000 | 2,045,000 |
| 2004 | 2,768,000 |
| 2008 | 3,357,000 |
| 2012 | 3,904,000 |
As the data shows, throughout the decade, the number of Asian voters increased steadily from 2,045,000 to 3,904,000. However, Asians only represent 3.9% of all eligible electorates and 2.9% of the voting population. This is little considering that Asians make up 5.6% of the U.S. population.
CONCLUSION
For both economic contribution and civic engagement, it can be seen that there was a steady increase in the Korean and Asian population. For economic contribution, we could observe that the growth within Korean businesses was faster than that of the Asian group. In terms of civic engagement, albeit there is a steady increase, the population of Asian voters is very small compared to the population of Asians in the United States.
*Tables and Graphs
Source: U.S. Census Bureau, 2007-2012 Survey of Business Owners
CONCLUSION II
Last Updated August 2020
For both economic contribution and civic engagement, it can be seen that there was a steady increase in the Korean and Asian population. However, despite the fact that the growth within Korean businesses was faster than that of the Asian group, Koreans may experience that their political voice is disproportionate to their economic status. Although there is a steady increase in terms of civic engagement, the population of Asian voters is disproportionately small compared to the population of Asians in the United States.
KAC advises the Korean American community to take the 2020 Census as an opportunity to level the gap between economic status and political power. As a quickly growing part of the economic contribution of the United States, Korean Americans should similarly see an upward trend in being recognized and counted. Not only will Korean Americans benefit from getting counted in the Census, but business owners can also use new Census data to advance their business operations, from providing accurate targeting that seeks out new customers to evaluating best offerings for their communities.
According to the Pew Research Center, Asian Americans are the fastest-growing demographic of eligible voters compared to other major races and ethnicities, but looking at the U.S Census Data, we see that Asian Americans only had a 49% voter turnout during the 2016 presidential elections.
The lack of accurate disaggregated data on the impact of COVID-19 on Asian Americans seem to show the lack of interest in supporting minority groups in the US. There has been a lack of inclusivity and sensitivity when it comes to providing aid, and making sure that the aid meets the people who need them. In order to create a larger political voice, civic engagement is an action that tops the priority list.
Recommendations:
- Work towards advocating for getting the Asian American community to register to vote and get counted in the Census
- Create long-term support for organizations who work in assisting minority communities and groups gain access to language resources
- Work towards gathering more information on how COVID-19 has disproportionately affected minority groups and POCs and making the data available to the public
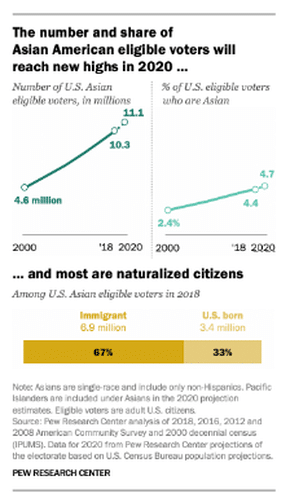
Sources:
- Pew Research Center: Asian Americans are the fastest-growing racial or ethnic group in the U.S. electorate
- US Census Data: 2018 American Community Survey
- McKinsey & Company: COVID-19 and advancing Asian American recovery
First Publication Date: August 2017.
Written and Compiled by: Christine Ku
Updated on August 2020.
Written and Compiled by: Kate Hur
Reviewed by: Esther Jung, Sophia Shin
